2014
Nouanesengsy, Boonthanome; Woodring, Jonathan; Patchett, John; Myers, Kary; Ahrens, James
ADR visualization: A generalized framework for ranking large-scale scientific data using Analysis-Driven Refinement Proceedings Article
In: Large Data Analysis and Visualization (LDAV), 2014 IEEE 4th Symposium on, pp. 43–50, IEEE 2014, (LA-UR-pending).
Abstract | Links | BibTeX | Tags: adaptive mesh refinement, ADR, Analysis-Driven Refinement, big data, data triage, focus+context, hardware architecture, large-scale data, parallel processing, picture/image generation, prioritization, scientific data, viewing algorithms
@inproceedings{nouanesengsy2014adr,
title = {ADR visualization: A generalized framework for ranking large-scale scientific data using Analysis-Driven Refinement},
author = {Boonthanome Nouanesengsy and Jonathan Woodring and John Patchett and Kary Myers and James Ahrens},
url = {http://datascience.dsscale.org/wp-content/uploads/2016/06/ADRVisualization.pdf},
year = {2014},
date = {2014-01-01},
booktitle = {Large Data Analysis and Visualization (LDAV), 2014 IEEE 4th Symposium on},
pages = {43--50},
organization = {IEEE},
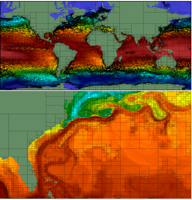
abstract = {Prioritization of data is necessary for managing large-scale scien- tific data, as the scale of the data implies that there are only enough resources available to process a limited subset of the data. For ex- ample, data prioritization is used during in situ triage to scale with bandwidth bottlenecks, and used during focus+context visualiza- tion to save time during analysis by guiding the user to impor- tant information. In this paper, we present ADR visualization, a generalized analysis framework for ranking large-scale data using Analysis-Driven Refinement (ADR), which is inspired by Adaptive Mesh Refinement (AMR). A large-scale data set is partitioned in space, time, and variable, using user-defined importance measure- ments for prioritization. This process creates a prioritization tree over the data set. Using this tree, selection methods can generate sparse data products for analysis, such as focus+context visualiza- tions or sparse data sets.},
note = {LA-UR-pending},
keywords = {adaptive mesh refinement, ADR, Analysis-Driven Refinement, big data, data triage, focus+context, hardware architecture, large-scale data, parallel processing, picture/image generation, prioritization, scientific data, viewing algorithms},
pubstate = {published},
tppubtype = {inproceedings}
}
Nouanesengsy, Boonthanome; Woodring, Jonathan; Patchett, John; Myers, Kary; Ahrens, James
ADR visualization: A generalized framework for ranking large-scale scientific data using Analysis-Driven Refinement Proceedings Article
In: Large Data Analysis and Visualization (LDAV), 2014 IEEE 4th Symposium on, pp. 43–50, IEEE 2014, (LA-UR-pending).
@inproceedings{nouanesengsy2014adr,

title = {ADR visualization: A generalized framework for ranking large-scale scientific data using Analysis-Driven Refinement},

author = {Boonthanome Nouanesengsy and Jonathan Woodring and John Patchett and Kary Myers and James Ahrens},

url = {http://datascience.dsscale.org/wp-content/uploads/2016/06/ADRVisualization.pdf},

year  = {2014},

date = {2014-01-01},

booktitle = {Large Data Analysis and Visualization (LDAV), 2014 IEEE 4th Symposium on},

pages = {43--50},

organization = {IEEE},

abstract = {Prioritization of data is necessary for managing large-scale scien- tific data, as the scale of the data implies that there are only enough resources available to process a limited subset of the data. For ex- ample, data prioritization is used during in situ triage to scale with bandwidth bottlenecks, and used during focus+context visualiza- tion to save time during analysis by guiding the user to impor- tant information. In this paper, we present ADR visualization, a generalized analysis framework for ranking large-scale data using Analysis-Driven Refinement (ADR), which is inspired by Adaptive Mesh Refinement (AMR). A large-scale data set is partitioned in space, time, and variable, using user-defined importance measure- ments for prioritization. This process creates a prioritization tree over the data set. Using this tree, selection methods can generate sparse data products for analysis, such as focus+context visualiza- tions or sparse data sets.},

note = {LA-UR-pending},

keywords = {},

pubstate = {published},

tppubtype = {inproceedings}

}