2022
Bujack, Roxana; Teti, Emily; Miller, Jonah; Caffrey, Elektra; Turton, Terece
The non-Riemannian nature of perceptual color space Journal Article
In: Proceedings of the National Academy of Sciences, vol. 119, no. 18, pp. e2119753119, 2022.
Abstract | Links | BibTeX | Tags: color perception, color theory
@article{<LineBreak>doi:10.1073/pnas.2119753119,
title = {The non-Riemannian nature of perceptual color space},
author = {Roxana Bujack and Emily Teti and Jonah Miller and Elektra Caffrey and Terece Turton},
url = {https://www.pnas.org/doi/abs/10.1073/pnas.2119753119},
doi = {10.1073/pnas.2119753119},
year = {2022},
date = {2022-01-01},
urldate = {2022-01-01},
journal = {Proceedings of the National Academy of Sciences},
volume = {119},
number = {18},
pages = {e2119753119},
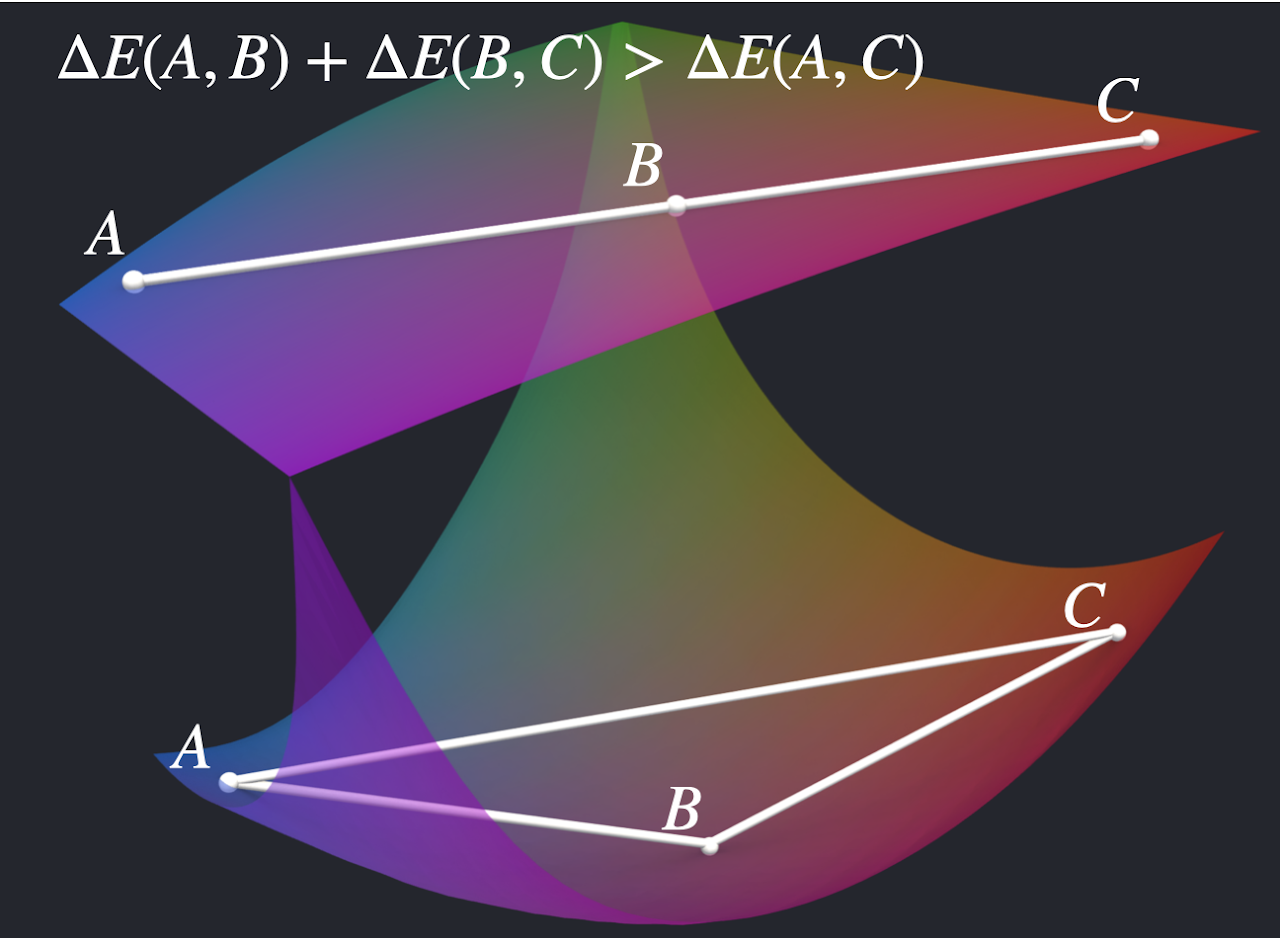
abstract = {The scientific community generally agrees on the theory, introduced by Riemann and furthered by Helmholtz and Schrödinger, that perceived color space is not Euclidean but rather, a three-dimensional Riemannian space. We show that the principle of diminishing returns applies to human color perception. This means that large color differences cannot be derived by adding a series of small steps, and therefore, perceptual color space cannot be described by a Riemannian geometry. This finding is inconsistent with the current approaches to modeling perceptual color space. Therefore, the assumed shape of color space requires a paradigm shift. Consequences of this apply to color metrics that are currently used in image and video processing, color mapping, and the paint and textile industries. These metrics are valid only for small differences. Rethinking them outside of a Riemannian setting could provide a path to extending them to large differences. This finding further hints at the existence of a second-order Weber–Fechner law describing perceived differences.},
keywords = {color perception, color theory},
pubstate = {published},
tppubtype = {article}
}
2020
Zeller, Stephanie; Rogers, David
Visualizing Science: How Color Determines What We See Journal Article
In: 2020, (Published in EOS: Science News by AGU).
Abstract | Links | BibTeX | Tags: color, color theory, mathematical geophysics
@article{szellerEOS2020,

title = {Visualizing Science: How Color Determines What We See},

author = {Stephanie Zeller and David Rogers},

url = {https://eos.org/features/visualizing-science-how-color-determines-what-we-see},

year  = {2020},

date = {2020-05-21},

urldate = {2020-05-21},

publisher = {EOS},

abstract = {Color plays a major role in the analysis and communication of scientific information. New tools are helping to improve how color can be applied more accurately and effectively to data.},

note = {Published in EOS: Science News by AGU},

keywords = {color, color theory, mathematical geophysics},

pubstate = {published},

tppubtype = {article}

}
2017
Bujack, Roxana; Turton, Terece; Samsel, Francesca; Ware, Colin; Rogers, David; Ahrens, James
The Good, the Bad, and the Ugly: A Theoretical Framework for the Assessment of Continuous Colormaps Proceedings Article
In: IEEE Visualization, 2017.
Abstract | Links | BibTeX | Tags: color theory, colormaps, linearity
@inproceedings{bujack2017good,
title = {The Good, the Bad, and the Ugly: A Theoretical Framework for the Assessment of Continuous Colormaps},
author = {Roxana Bujack and Terece Turton and Francesca Samsel and Colin Ware and David Rogers and James Ahrens},
url = {http://datascience.dsscale.org/wp-content/uploads/2017/10/TheGoodtheBadandtheUgly.pdf},
year = {2017},
date = {2017-01-01},
booktitle = {IEEE Visualization},
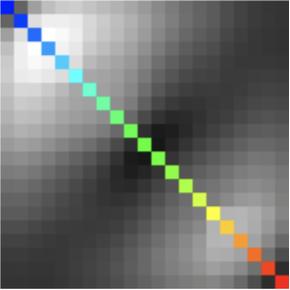
abstract = {A myriad of design rules for what constitutes a “good” colormap can be found in the literature. Some common rules include order, uniformity, and high discriminative power. However, the meaning of many of these terms is often ambiguous or open to interpretation. At times, different authors may use the same term to describe different concepts or the same rule is described by varying nomenclature. These ambiguities stand in the way of collaborative work, the design of experiments to assess the characteristics of colormaps, and automated colormap generation.
In this paper, we review current and historical guidelines for colormap design. We propose a specified taxonomy and provide unambiguous mathematical definitions for the most common design rules.},
keywords = {color theory, colormaps, linearity},
pubstate = {published},
tppubtype = {inproceedings}
}
In this paper, we review current and historical guidelines for colormap design. We propose a specified taxonomy and provide unambiguous mathematical definitions for the most common design rules.
2016
Samsel, Francesca; Klassen, Sebastian; Petersen, Mark; Turton, Terece; Abram, Greg; Rogers, David; Ahrens, James
Interactive Colormapping: Enabling Multiple Data Ranges, Detailed Views of Ocean Salinity Proceedings Article
In: Proceedings of the 34rd Annual ACM Conference Extended Abstracts on Human Factors in Computing Systems, ACM, San Jose, California, 2016, (LA-UR-15-20105).
Abstract | Links | BibTeX | Tags: climate science, color perception, color theory, colormaps, high-resolution datasets, scientific visualization
@inproceedings{Samsel:2016:CIP:2702613.2702975,
title = {Interactive Colormapping: Enabling Multiple Data Ranges, Detailed Views of Ocean Salinity},
author = {Francesca Samsel and Sebastian Klassen and Mark Petersen and Terece Turton and Greg Abram and David Rogers and James Ahrens},
url = {http://datascience.dsscale.org/wp-content/uploads/2016/06/InteractiveColormapping.pdf},
year = {2016},
date = {2016-01-01},
booktitle = {Proceedings of the 34rd Annual ACM Conference Extended Abstracts on Human Factors in Computing Systems},
publisher = {ACM},
address = {San Jose, California},
series = {CHI EA '16},
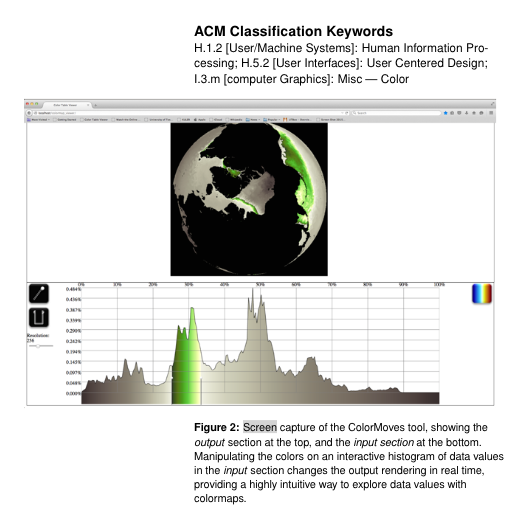
abstract = {Ocean salinity is a critical component to understanding climate change. Salinity concentrations and temperature drive large ocean currents which in turn drive global weather patterns. Melting ice caps lower salinity at the poles while river deltas bring fresh water into the ocean worldwide. These processes slow ocean currents, changing weather patterns and producing extreme climate events which disproportionally affect those living in poverty. Analysis of salinity presents a unique visualization challenge. Important data are found in narrow data ranges, varying with global location. Changing values of salinity are important in understanding ocean currents, but are difficult to map to colors using traditional tools. Commonly used colormaps may not provide sufficient detail for this data. Current editing tools do not easily enable a scientist to explore the subtleties of salinity. We present a workflow, enabled by an interactive colormap tool that allows a scientist to interactively apply sophisticated colormaps to scalar data. The intuitive and immediate interaction of the scientist with the data is a critical contribution of this work.},
note = {LA-UR-15-20105},
keywords = {climate science, color perception, color theory, colormaps, high-resolution datasets, scientific visualization},
pubstate = {published},
tppubtype = {inproceedings}
}
2015
Samsel, Francesca; Petersen, Mark; Geld, Terece; Abram, Greg; Wendelberger, Joanne; Ahrens, James
Colormaps That Improve Perception of High-Resolution Ocean Data Proceedings Article
In: Proceedings of the 33rd Annual ACM Conference Extended Abstracts on Human Factors in Computing Systems, pp. 703–710, ACM, Seoul, Republic of Korea, 2015, ISBN: 978-1-4503-3146-3, (LA-UR-15-20105).
Abstract | Links | BibTeX | Tags: climate science, color perception, color theory, colormaps, high-resolution datasets, scientific visualization
@inproceedings{Samsel:2015:CIP:2702613.2702975,
title = {Colormaps That Improve Perception of High-Resolution Ocean Data},
author = {Francesca Samsel and Mark Petersen and Terece Geld and Greg Abram and Joanne Wendelberger and James Ahrens},
url = {http://datascience.dsscale.org/wp-content/uploads/2016/06/ColormapsThatImprovePerceptionOfHigh-ResolutionOceanData.pdf},
doi = {10.1145/2702613.2702975},
isbn = {978-1-4503-3146-3},
year = {2015},
date = {2015-01-01},
booktitle = {Proceedings of the 33rd Annual ACM Conference Extended Abstracts on Human Factors in Computing Systems},
pages = {703--710},
publisher = {ACM},
address = {Seoul, Republic of Korea},
series = {CHI EA '15},
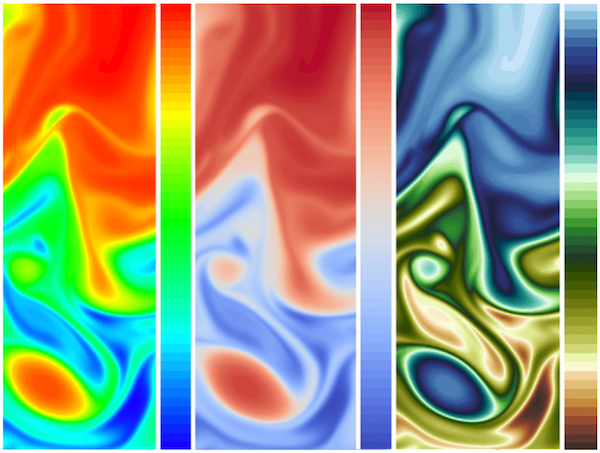
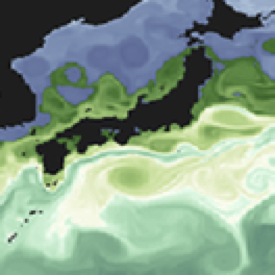
abstract = {Scientists from the Climate, Ocean and Sea Ice Modeling Team (COSIM) at the Los Alamos National Laboratory (LANL) are interested in gaining a deeper understanding of three primary ocean currents: the Gulf Stream, the Kuroshio Current, and the Agulhas Current & Retroflection. To address these needs, visual artist Francesca Samsel teamed up with experts from the areas of computer science, climate science, statistics, and perceptual science. By engaging an artist specializing in color, we created colormaps that provide the ability to see greater detail in these high-resolution datasets. The new colormaps applied to the POP dataset enabled scientists to see areas of interest unclear using standard colormaps. Improvements in the perceptual range of color allowed scientists to highlight structures within specific ocean currents. Work with the COSIM team members drove development of nested colormaps which provide further detail to the scientists.},
note = {LA-UR-15-20105},
keywords = {climate science, color perception, color theory, colormaps, high-resolution datasets, scientific visualization},
pubstate = {published},
tppubtype = {inproceedings}
}
Bujack, Roxana; Teti, Emily; Miller, Jonah; Caffrey, Elektra; Turton, Terece
The non-Riemannian nature of perceptual color space Journal Article
In: Proceedings of the National Academy of Sciences, vol. 119, no. 18, pp. e2119753119, 2022.
@article{<LineBreak>doi:10.1073/pnas.2119753119,

title = {The non-Riemannian nature of perceptual color space},

author = {Roxana Bujack and Emily Teti and Jonah Miller and Elektra Caffrey and Terece Turton},

url = {https://www.pnas.org/doi/abs/10.1073/pnas.2119753119},

doi = {10.1073/pnas.2119753119},

year  = {2022},

date = {2022-01-01},

urldate = {2022-01-01},

journal = {Proceedings of the National Academy of Sciences},

volume = {119},

number = {18},

pages = {e2119753119},

abstract = {The scientific community generally agrees on the theory, introduced by Riemann and furthered by Helmholtz and Schrödinger, that perceived color space is not Euclidean but rather, a three-dimensional Riemannian space. We show that the principle of diminishing returns applies to human color perception. This means that large color differences cannot be derived by adding a series of small steps, and therefore, perceptual color space cannot be described by a Riemannian geometry. This finding is inconsistent with the current approaches to modeling perceptual color space. Therefore, the assumed shape of color space requires a paradigm shift. Consequences of this apply to color metrics that are currently used in image and video processing, color mapping, and the paint and textile industries. These metrics are valid only for small differences. Rethinking them outside of a Riemannian setting could provide a path to extending them to large differences. This finding further hints at the existence of a second-order Weber–Fechner law describing perceived differences.},

keywords = {},

pubstate = {published},

tppubtype = {article}

}
Zeller, Stephanie; Rogers, David
Visualizing Science: How Color Determines What We See Journal Article
In: 2020, (Published in EOS: Science News by AGU).
@article{szellerEOS2020,

title = {Visualizing Science: How Color Determines What We See},

author = {Stephanie Zeller and David Rogers},

url = {https://eos.org/features/visualizing-science-how-color-determines-what-we-see},

year  = {2020},

date = {2020-05-21},

urldate = {2020-05-21},

publisher = {EOS},

abstract = {Color plays a major role in the analysis and communication of scientific information. New tools are helping to improve how color can be applied more accurately and effectively to data.},

note = {Published in EOS: Science News by AGU},

keywords = {},

pubstate = {published},

tppubtype = {article}

}
Bujack, Roxana; Turton, Terece; Samsel, Francesca; Ware, Colin; Rogers, David; Ahrens, James
The Good, the Bad, and the Ugly: A Theoretical Framework for the Assessment of Continuous Colormaps Proceedings Article
In: IEEE Visualization, 2017.
@inproceedings{bujack2017good,

title = {The Good, the Bad, and the Ugly: A Theoretical Framework for the Assessment of Continuous Colormaps},

author = {Roxana Bujack and Terece Turton and Francesca Samsel and Colin Ware and David Rogers and James Ahrens},

url = {http://datascience.dsscale.org/wp-content/uploads/2017/10/TheGoodtheBadandtheUgly.pdf},

year  = {2017},

date = {2017-01-01},

booktitle = {IEEE Visualization},

abstract = {A myriad of design rules for what constitutes a “good” colormap can be found in the literature. Some common rules include order, uniformity, and high discriminative power. However, the meaning of many of these terms is often ambiguous or open to interpretation. At times, different authors may use the same term to describe different concepts or the same rule is described by varying nomenclature. These ambiguities stand in the way of collaborative work, the design of experiments to assess the characteristics of colormaps, and automated colormap generation.

In this paper, we review current and historical guidelines for colormap design. We propose a specified taxonomy and provide unambiguous mathematical definitions for the most common design rules.},

keywords = {},

pubstate = {published},

tppubtype = {inproceedings}

}
In this paper, we review current and historical guidelines for colormap design. We propose a specified taxonomy and provide unambiguous mathematical definitions for the most common design rules.
Samsel, Francesca; Klassen, Sebastian; Petersen, Mark; Turton, Terece; Abram, Greg; Rogers, David; Ahrens, James
Interactive Colormapping: Enabling Multiple Data Ranges, Detailed Views of Ocean Salinity Proceedings Article
In: Proceedings of the 34rd Annual ACM Conference Extended Abstracts on Human Factors in Computing Systems, ACM, San Jose, California, 2016, (LA-UR-15-20105).
@inproceedings{Samsel:2016:CIP:2702613.2702975,

title = {Interactive Colormapping: Enabling Multiple Data Ranges, Detailed Views of Ocean Salinity},

author = {Francesca Samsel and Sebastian Klassen and Mark Petersen and Terece Turton and Greg Abram and David Rogers and James Ahrens},

url = {http://datascience.dsscale.org/wp-content/uploads/2016/06/InteractiveColormapping.pdf},

year  = {2016},

date = {2016-01-01},

booktitle = {Proceedings of the 34rd Annual ACM Conference Extended Abstracts on Human Factors in Computing Systems},

publisher = {ACM},

address = {San Jose, California},

series = {CHI EA '16},

abstract = {Ocean salinity is a critical component to understanding climate change. Salinity concentrations and temperature drive large ocean currents which in turn drive global weather patterns. Melting ice caps lower salinity at the poles while river deltas bring fresh water into the ocean worldwide. These processes slow ocean currents, changing weather patterns and producing extreme climate events which disproportionally affect those living in poverty. Analysis of salinity presents a unique visualization challenge. Important data are found in narrow data ranges, varying with global location. Changing values of salinity are important in understanding ocean currents, but are difficult to map to colors using traditional tools. Commonly used colormaps may not provide sufficient detail for this data. Current editing tools do not easily enable a scientist to explore the subtleties of salinity. We present a workflow, enabled by an interactive colormap tool that allows a scientist to interactively apply sophisticated colormaps to scalar data. The intuitive and immediate interaction of the scientist with the data is a critical contribution of this work.},

note = {LA-UR-15-20105},

keywords = {},

pubstate = {published},

tppubtype = {inproceedings}

}
Samsel, Francesca; Petersen, Mark; Geld, Terece; Abram, Greg; Wendelberger, Joanne; Ahrens, James
Colormaps That Improve Perception of High-Resolution Ocean Data Proceedings Article
In: Proceedings of the 33rd Annual ACM Conference Extended Abstracts on Human Factors in Computing Systems, pp. 703–710, ACM, Seoul, Republic of Korea, 2015, ISBN: 978-1-4503-3146-3, (LA-UR-15-20105).
@inproceedings{Samsel:2015:CIP:2702613.2702975,

title = {Colormaps That Improve Perception of High-Resolution Ocean Data},

author = {Francesca Samsel and Mark Petersen and Terece Geld and Greg Abram and Joanne Wendelberger and James Ahrens},

url = {http://datascience.dsscale.org/wp-content/uploads/2016/06/ColormapsThatImprovePerceptionOfHigh-ResolutionOceanData.pdf},

doi = {10.1145/2702613.2702975},

isbn = {978-1-4503-3146-3},

year  = {2015},

date = {2015-01-01},

booktitle = {Proceedings of the 33rd Annual ACM Conference Extended Abstracts on Human Factors in Computing Systems},

pages = {703--710},

publisher = {ACM},

address = {Seoul, Republic of Korea},

series = {CHI EA '15},

abstract = {Scientists from the Climate, Ocean and Sea Ice Modeling Team (COSIM) at the Los Alamos National Laboratory (LANL) are interested in gaining a deeper understanding of three primary ocean currents: the Gulf Stream, the Kuroshio Current, and the Agulhas Current & Retroflection. To address these needs, visual artist Francesca Samsel teamed up with experts from the areas of computer science, climate science, statistics, and perceptual science. By engaging an artist specializing in color, we created colormaps that provide the ability to see greater detail in these high-resolution datasets. The new colormaps applied to the POP dataset enabled scientists to see areas of interest unclear using standard colormaps. Improvements in the perceptual range of color allowed scientists to highlight structures within specific ocean currents. Work with the COSIM team members drove development of nested colormaps which provide further detail to the scientists.},

note = {LA-UR-15-20105},

keywords = {},

pubstate = {published},

tppubtype = {inproceedings}

}