2022
Bujack, Roxana; Teti, Emily; Miller, Jonah; Caffrey, Elektra; Turton, Terece
The non-Riemannian nature of perceptual color space Journal Article
In: Proceedings of the National Academy of Sciences, vol. 119, no. 18, pp. e2119753119, 2022.
Abstract | Links | BibTeX | Tags: color perception, color theory
@article{<LineBreak>doi:10.1073/pnas.2119753119,
title = {The non-Riemannian nature of perceptual color space},
author = {Roxana Bujack and Emily Teti and Jonah Miller and Elektra Caffrey and Terece Turton},
url = {https://www.pnas.org/doi/abs/10.1073/pnas.2119753119},
doi = {10.1073/pnas.2119753119},
year = {2022},
date = {2022-01-01},
urldate = {2022-01-01},
journal = {Proceedings of the National Academy of Sciences},
volume = {119},
number = {18},
pages = {e2119753119},
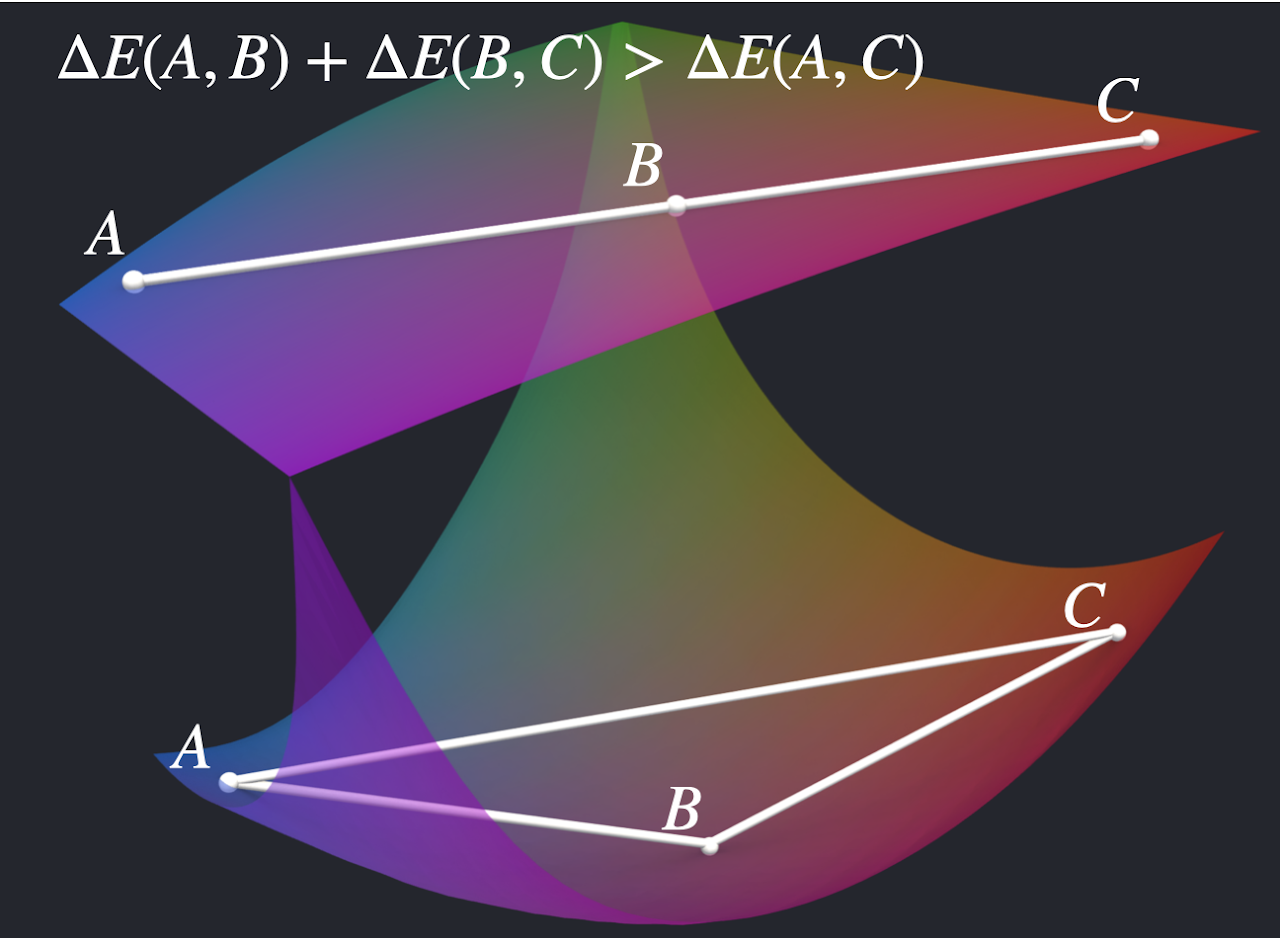
abstract = {The scientific community generally agrees on the theory, introduced by Riemann and furthered by Helmholtz and Schrödinger, that perceived color space is not Euclidean but rather, a three-dimensional Riemannian space. We show that the principle of diminishing returns applies to human color perception. This means that large color differences cannot be derived by adding a series of small steps, and therefore, perceptual color space cannot be described by a Riemannian geometry. This finding is inconsistent with the current approaches to modeling perceptual color space. Therefore, the assumed shape of color space requires a paradigm shift. Consequences of this apply to color metrics that are currently used in image and video processing, color mapping, and the paint and textile industries. These metrics are valid only for small differences. Rethinking them outside of a Riemannian setting could provide a path to extending them to large differences. This finding further hints at the existence of a second-order Weber–Fechner law describing perceived differences.},
keywords = {color perception, color theory},
pubstate = {published},
tppubtype = {article}
}
2021
Nardini, Pascal; Chen, Min; Bujack, Roxana; Bottinger, Michael; Scheuermann, Gerik
A Testing Environment for Continuous Colormaps Journal Article
In: IEEE Transactions on Visualization and Computer Graphics, vol. 27, no. 2, pp. 1043-1053, 2021.
Abstract | Links | BibTeX | Tags: color perception, scalar analysis, Testing Environment
@article{9216559,
title = {A Testing Environment for Continuous Colormaps},
author = {Pascal Nardini and Min Chen and Roxana Bujack and Michael Bottinger and Gerik Scheuermann},
url = {http://www.informatik.uni-leipzig.de/~bujack/2020Vis.pdf},
doi = {10.1109/TVCG.2020.3028955},
year = {2021},
date = {2021-01-01},
urldate = {2021-01-01},
journal = {IEEE Transactions on Visualization and Computer Graphics},
volume = {27},
number = {2},
pages = {1043-1053},
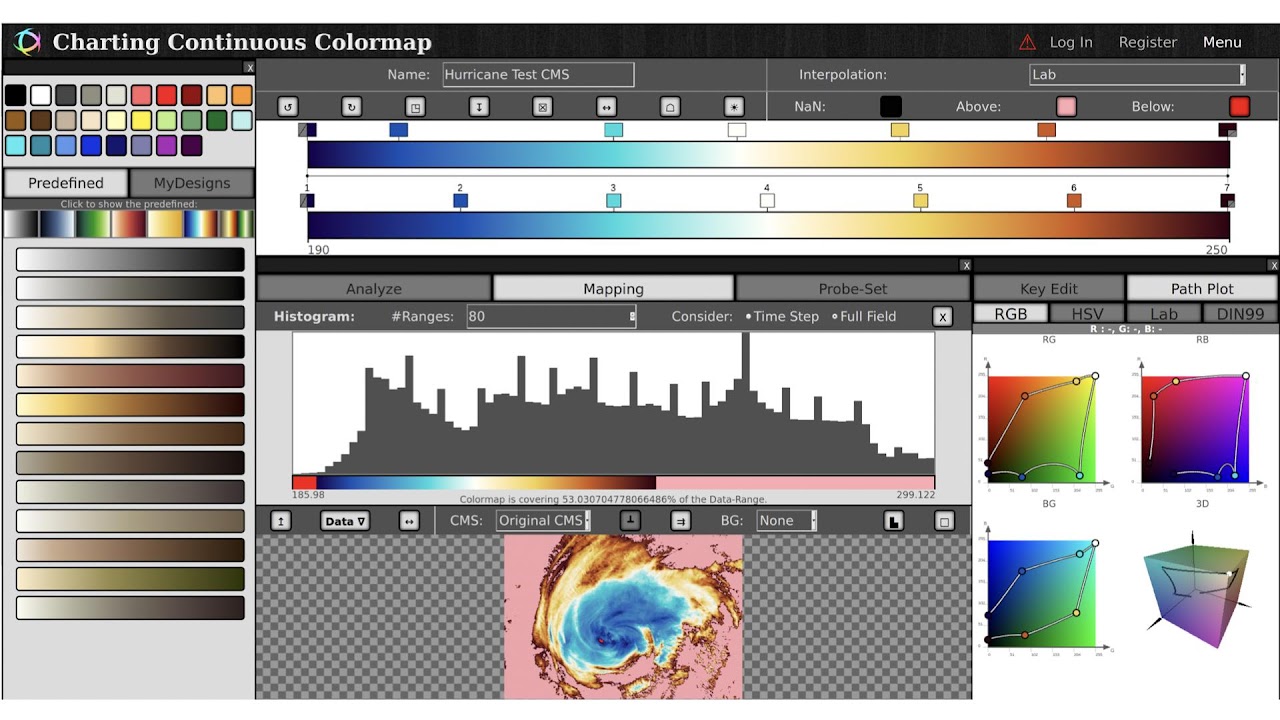
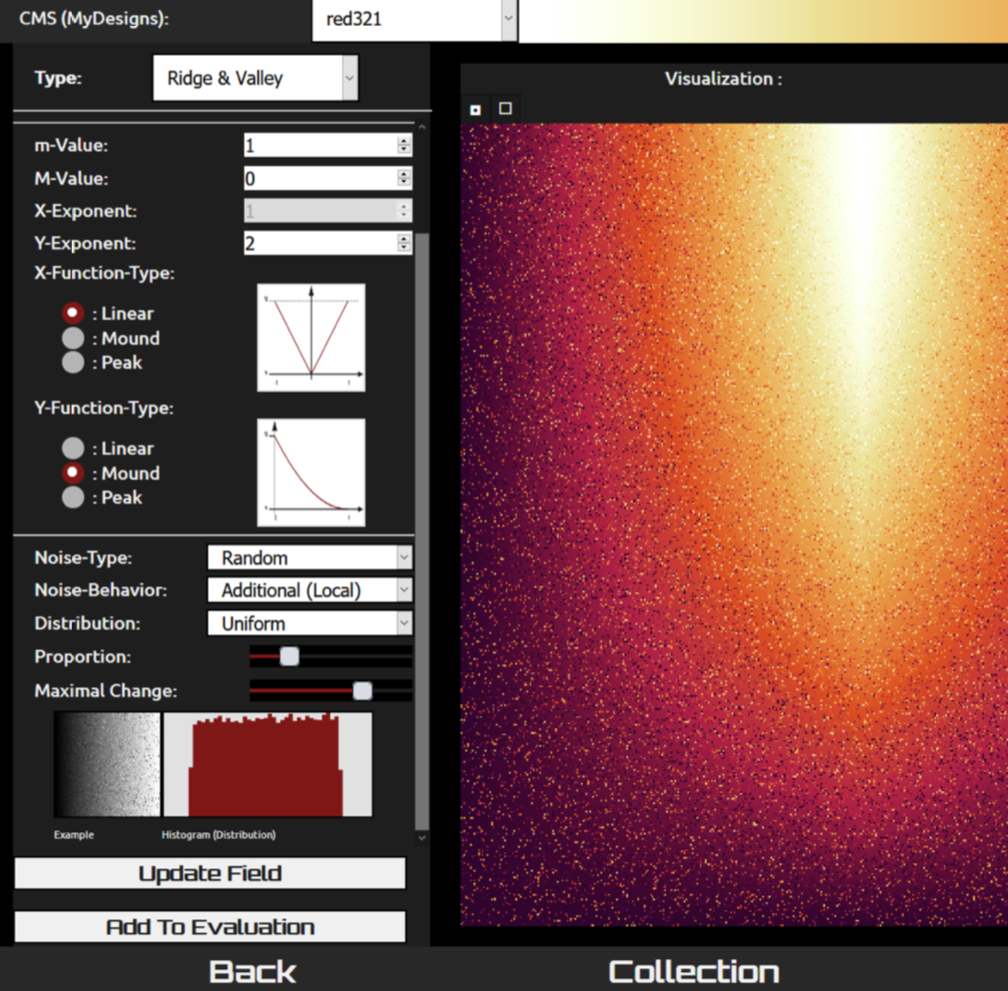
abstract = {Many computer science disciplines (e.g., combinatorial optimization, natural language processing, and information retrieval) use standard or established test suites for evaluating algorithms. In visualization, similar approaches have been adopted in some areas (e.g., volume visualization), while user testimonies and empirical studies have been the dominant means of evaluation in most other areas, such as designing colormaps. In this paper, we propose to establish a test suite for evaluating the design of colormaps. With such a suite, the users can observe the effects when different continuous colormaps are applied to planar scalar fields that may exhibit various characteristic features, such as jumps, local extrema, ridge or valley lines, different distributions of scalar values, different gradients, different signal frequencies, different levels of noise, and so on. The suite also includes an expansible collection of real-world data sets including the most popular data for colormap testing in the visualization literature. The test suite has been integrated into a web-based application for creating continuous colormaps (https://ccctool.com/), facilitating close inter-operation between design and evaluation processes. This new facility complements traditional evaluation methods such as user testimonies and empirical studies.},
keywords = {color perception, scalar analysis, Testing Environment},
pubstate = {published},
tppubtype = {article}
}
2019
Nardini, Pascal; Chen, Min; Samsel, Francesca; Bujack, Roxana; Bottinger, Michael; Scheuermann, Gerik
The making of continuous colormaps Journal Article
In: IEEE transactions on visualization and computer graphics, vol. 27, no. 6, pp. 3048–3063, 2019.
Abstract | Links | BibTeX | Tags: ccc-tool, color perception, colormaps
@article{nardini2019making,

title = {The making of continuous colormaps},

author = {Pascal Nardini and Min Chen and Francesca Samsel and Roxana Bujack and Michael Bottinger and Gerik Scheuermann},

url = {http://www.informatik.uni-leipzig.de/~bujack/2020ccc.pdf},

year  = {2019},

date = {2019-01-01},

urldate = {2019-01-01},

journal = {IEEE transactions on visualization and computer graphics},

volume = {27},

number = {6},

pages = {3048--3063},

publisher = {IEEE},

abstract = {Continuous colormaps are integral parts of many visualization techniques, such as heat-maps, surface plots, and flow visualization. Despite that the critiques of rainbow colormaps have been around and well-acknowledged for three decades, rainbow colormaps are still widely used today. One reason behind the resilience of rainbow colormaps is the lack of tools for users to create a continuous colormap that encodes semantics specific to the application concerned. In this paper, we present a web-based software system, CCC-Tool (short for Charting Continuous Colormaps) under the URL https://ccctool.com, for creating, editing, and analyzing such application-specific colormaps. We introduce the notion of “colormap specification (CMS)” that maintains the essential semantics required for defining a color mapping scheme. We provide users with a set of advanced utilities for constructing CMS’s with various levels of complexity, examining their quality attributes using different plots, and exporting them to external application software. We present two case studies, demonstrating that the CCC-Tool can help domain scientists as well as visualization experts in designing semantically-rich colormaps.},

keywords = {ccc-tool, color perception, colormaps},

pubstate = {published},

tppubtype = {article}

}
2018
Ware, Colin; Turton, Terece; Bujack, Roxana; Samsel, Francesca; Shrivastava, Piyush; Rogers, David
Measuring and Modeling the Feature Detection Threshold Functions of Colormaps Journal Article
In: IEEE Transactions on Visualization and Computer Graphics, pp. 1-1, 2018, ISSN: 1077-2626, (LA-UR-18-21476).
Abstract | Links | BibTeX | Tags: color perception, Colormapping, feature extraction, frequency measurements, Image color analysis, sea measurements, sensitivity, spatial resolution, Task analysis
@article{8413174,
title = {Measuring and Modeling the Feature Detection Threshold Functions of Colormaps},
author = {Colin Ware and Terece Turton and Roxana Bujack and Francesca Samsel and Piyush Shrivastava and David Rogers},
url = {https://ieeexplore.ieee.org/document/8413174},
doi = {10.1109/TVCG.2018.2855742},
issn = {1077-2626},
year = {2018},
date = {2018-01-01},
journal = {IEEE Transactions on Visualization and Computer Graphics},
pages = {1-1},
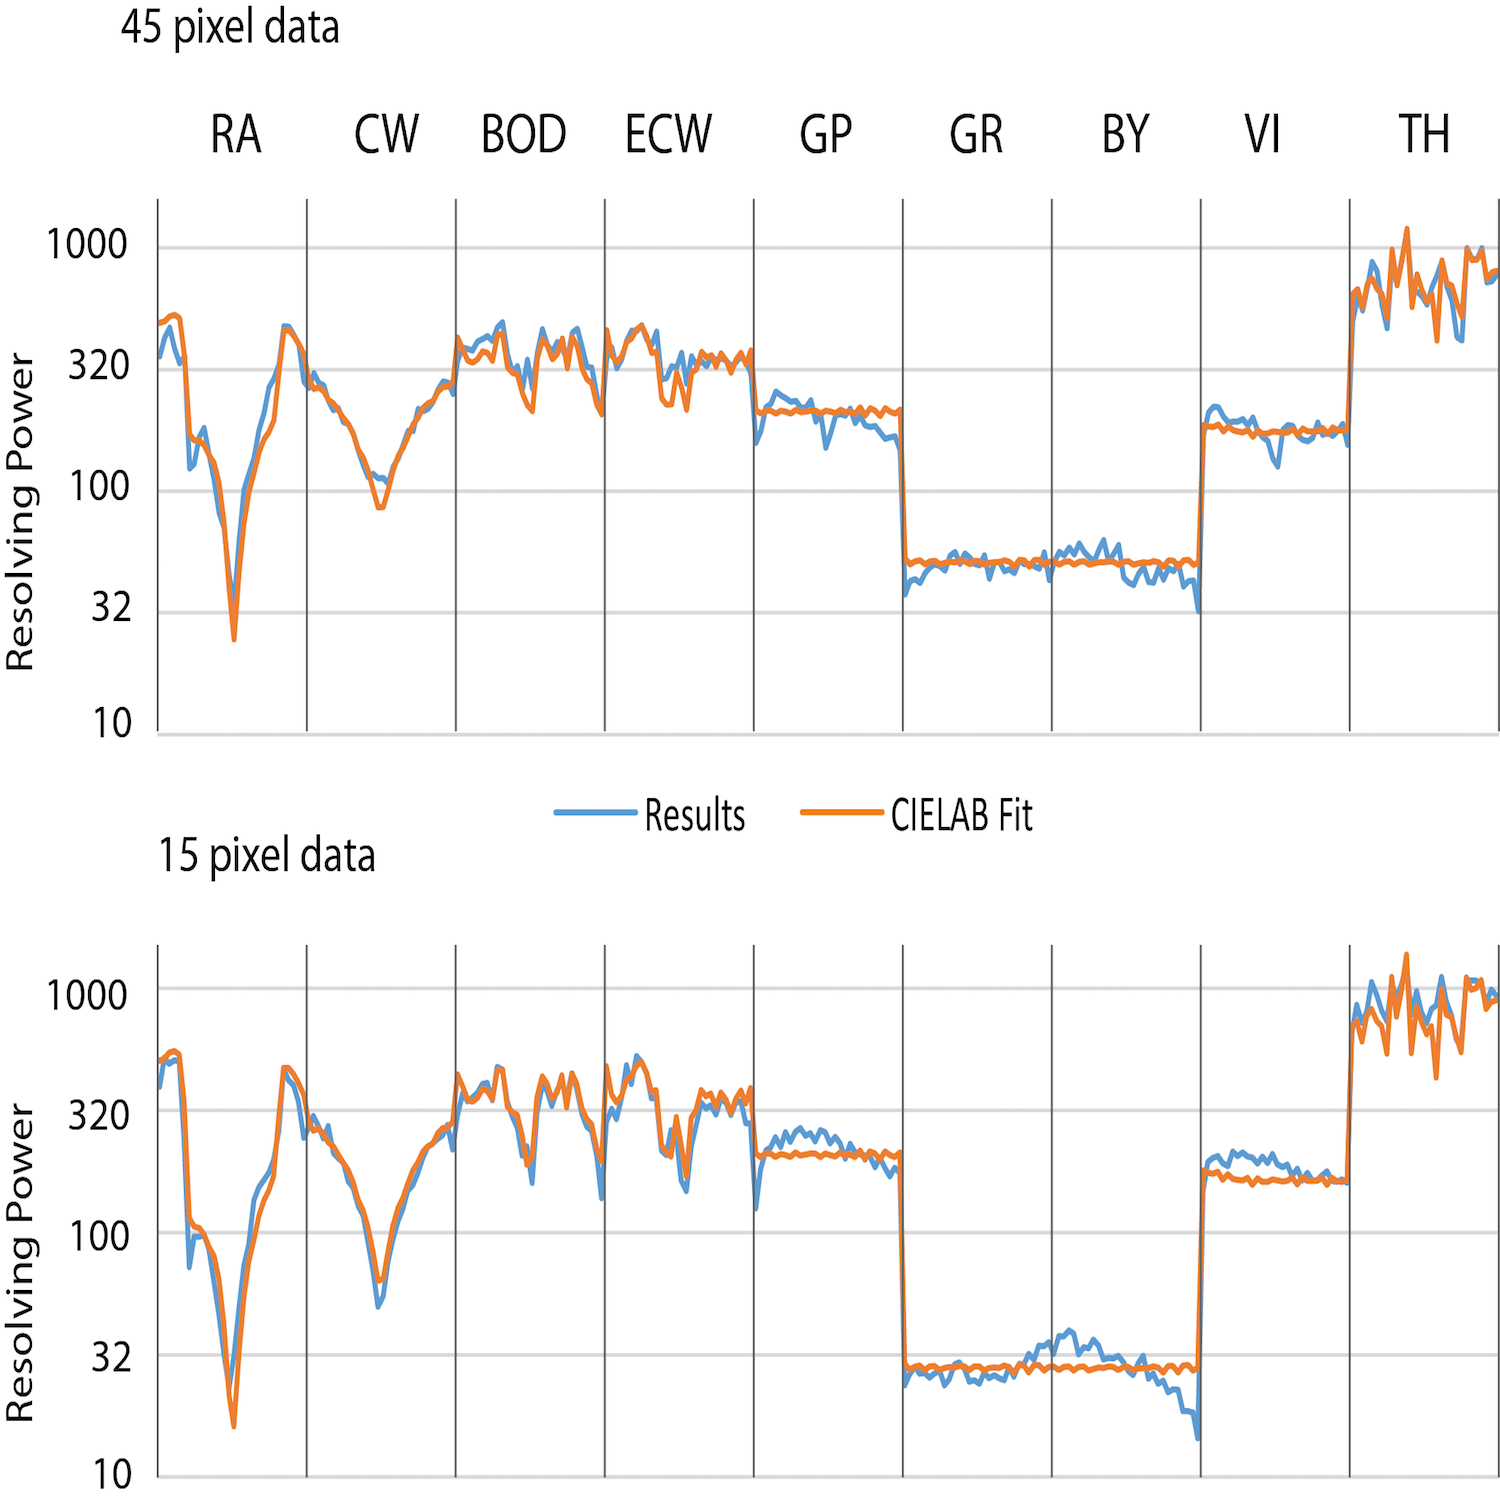
abstract = {Pseudocoloring is one of the most common techniques used in scientific visualization. To apply pseudocoloring to a scalar field, the field value at each point is represented using one of a sequence of colors (called a colormap). One of the principles applied in generating colormaps is uniformity and previously the main method for determining uniformity has been the application of uniform color spaces. Here we present a new method for evaluating the feature discrimination threshold function across a colormap. The method is used in crowdsourced studies for the direct evaluation of nine colormaps for three feature sizes. The results are used to test the hypothesis that a uniform color space (CIELAB) gives too much weight to chromatic differences compared to luminance differences because of the way it was constructed. The hypothesis that feature discrimination can be predicted solely on the basis of luminance is also tested. The results reject both hypotheses and we demonstrate how reduced weights on the green-red and blue-yellow terms of the CIELAB color space creates a more accurate model when the task is the detection of smaller features in colormapped data. Both the method itself and modified CIELAB can be used in colormap design and evaluation.},
note = {LA-UR-18-21476},
keywords = {color perception, Colormapping, feature extraction, frequency measurements, Image color analysis, sea measurements, sensitivity, spatial resolution, Task analysis},
pubstate = {published},
tppubtype = {article}
}
2016
Samsel, Francesca; Klassen, Sebastian; Petersen, Mark; Turton, Terece; Abram, Greg; Rogers, David; Ahrens, James
Interactive Colormapping: Enabling Multiple Data Ranges, Detailed Views of Ocean Salinity Proceedings Article
In: Proceedings of the 34rd Annual ACM Conference Extended Abstracts on Human Factors in Computing Systems, ACM, San Jose, California, 2016, (LA-UR-15-20105).
Abstract | Links | BibTeX | Tags: climate science, color perception, color theory, colormaps, high-resolution datasets, scientific visualization
@inproceedings{Samsel:2016:CIP:2702613.2702975,

title = {Interactive Colormapping: Enabling Multiple Data Ranges, Detailed Views of Ocean Salinity},

author = {Francesca Samsel and Sebastian Klassen and Mark Petersen and Terece Turton and Greg Abram and David Rogers and James Ahrens},

url = {http://datascience.dsscale.org/wp-content/uploads/2016/06/InteractiveColormapping.pdf},

year  = {2016},

date = {2016-01-01},

booktitle = {Proceedings of the 34rd Annual ACM Conference Extended Abstracts on Human Factors in Computing Systems},

publisher = {ACM},

address = {San Jose, California},

series = {CHI EA '16},

abstract = {Ocean salinity is a critical component to understanding climate change. Salinity concentrations and temperature drive large ocean currents which in turn drive global weather patterns. Melting ice caps lower salinity at the poles while river deltas bring fresh water into the ocean worldwide. These processes slow ocean currents, changing weather patterns and producing extreme climate events which disproportionally affect those living in poverty. Analysis of salinity presents a unique visualization challenge. Important data are found in narrow data ranges, varying with global location. Changing values of salinity are important in understanding ocean currents, but are difficult to map to colors using traditional tools. Commonly used colormaps may not provide sufficient detail for this data. Current editing tools do not easily enable a scientist to explore the subtleties of salinity. We present a workflow, enabled by an interactive colormap tool that allows a scientist to interactively apply sophisticated colormaps to scalar data. The intuitive and immediate interaction of the scientist with the data is a critical contribution of this work.},

note = {LA-UR-15-20105},

keywords = {climate science, color perception, color theory, colormaps, high-resolution datasets, scientific visualization},

pubstate = {published},

tppubtype = {inproceedings}

}
2015
Samsel, Francesca; Petersen, Mark; Geld, Terece; Abram, Greg; Wendelberger, Joanne; Ahrens, James
Colormaps That Improve Perception of High-Resolution Ocean Data Proceedings Article
In: Proceedings of the 33rd Annual ACM Conference Extended Abstracts on Human Factors in Computing Systems, pp. 703–710, ACM, Seoul, Republic of Korea, 2015, ISBN: 978-1-4503-3146-3, (LA-UR-15-20105).
Abstract | Links | BibTeX | Tags: climate science, color perception, color theory, colormaps, high-resolution datasets, scientific visualization
@inproceedings{Samsel:2015:CIP:2702613.2702975,

title = {Colormaps That Improve Perception of High-Resolution Ocean Data},

author = {Francesca Samsel and Mark Petersen and Terece Geld and Greg Abram and Joanne Wendelberger and James Ahrens},

url = {http://datascience.dsscale.org/wp-content/uploads/2016/06/ColormapsThatImprovePerceptionOfHigh-ResolutionOceanData.pdf},

doi = {10.1145/2702613.2702975},

isbn = {978-1-4503-3146-3},

year  = {2015},

date = {2015-01-01},

booktitle = {Proceedings of the 33rd Annual ACM Conference Extended Abstracts on Human Factors in Computing Systems},

pages = {703--710},

publisher = {ACM},

address = {Seoul, Republic of Korea},

series = {CHI EA '15},

abstract = {Scientists from the Climate, Ocean and Sea Ice Modeling Team (COSIM) at the Los Alamos National Laboratory (LANL) are interested in gaining a deeper understanding of three primary ocean currents: the Gulf Stream, the Kuroshio Current, and the Agulhas Current & Retroflection. To address these needs, visual artist Francesca Samsel teamed up with experts from the areas of computer science, climate science, statistics, and perceptual science. By engaging an artist specializing in color, we created colormaps that provide the ability to see greater detail in these high-resolution datasets. The new colormaps applied to the POP dataset enabled scientists to see areas of interest unclear using standard colormaps. Improvements in the perceptual range of color allowed scientists to highlight structures within specific ocean currents. Work with the COSIM team members drove development of nested colormaps which provide further detail to the scientists.},

note = {LA-UR-15-20105},

keywords = {climate science, color perception, color theory, colormaps, high-resolution datasets, scientific visualization},

pubstate = {published},

tppubtype = {inproceedings}

}
Bujack, Roxana; Teti, Emily; Miller, Jonah; Caffrey, Elektra; Turton, Terece
The non-Riemannian nature of perceptual color space Journal Article
In: Proceedings of the National Academy of Sciences, vol. 119, no. 18, pp. e2119753119, 2022.
@article{<LineBreak>doi:10.1073/pnas.2119753119,

title = {The non-Riemannian nature of perceptual color space},

author = {Roxana Bujack and Emily Teti and Jonah Miller and Elektra Caffrey and Terece Turton},

url = {https://www.pnas.org/doi/abs/10.1073/pnas.2119753119},

doi = {10.1073/pnas.2119753119},

year  = {2022},

date = {2022-01-01},

urldate = {2022-01-01},

journal = {Proceedings of the National Academy of Sciences},

volume = {119},

number = {18},

pages = {e2119753119},

abstract = {The scientific community generally agrees on the theory, introduced by Riemann and furthered by Helmholtz and Schrödinger, that perceived color space is not Euclidean but rather, a three-dimensional Riemannian space. We show that the principle of diminishing returns applies to human color perception. This means that large color differences cannot be derived by adding a series of small steps, and therefore, perceptual color space cannot be described by a Riemannian geometry. This finding is inconsistent with the current approaches to modeling perceptual color space. Therefore, the assumed shape of color space requires a paradigm shift. Consequences of this apply to color metrics that are currently used in image and video processing, color mapping, and the paint and textile industries. These metrics are valid only for small differences. Rethinking them outside of a Riemannian setting could provide a path to extending them to large differences. This finding further hints at the existence of a second-order Weber–Fechner law describing perceived differences.},

keywords = {},

pubstate = {published},

tppubtype = {article}

}
Nardini, Pascal; Chen, Min; Bujack, Roxana; Bottinger, Michael; Scheuermann, Gerik
A Testing Environment for Continuous Colormaps Journal Article
In: IEEE Transactions on Visualization and Computer Graphics, vol. 27, no. 2, pp. 1043-1053, 2021.
@article{9216559,

title = {A Testing Environment for Continuous Colormaps},

author = {Pascal Nardini and Min Chen and Roxana Bujack and Michael Bottinger and Gerik Scheuermann},

url = {http://www.informatik.uni-leipzig.de/~bujack/2020Vis.pdf},

doi = {10.1109/TVCG.2020.3028955},

year  = {2021},

date = {2021-01-01},

urldate = {2021-01-01},

journal = {IEEE Transactions on Visualization and Computer Graphics},

volume = {27},

number = {2},

pages = {1043-1053},

abstract = {Many computer science disciplines (e.g., combinatorial optimization, natural language processing, and information retrieval) use standard or established test suites for evaluating algorithms. In visualization, similar approaches have been adopted in some areas (e.g., volume visualization), while user testimonies and empirical studies have been the dominant means of evaluation in most other areas, such as designing colormaps. In this paper, we propose to establish a test suite for evaluating the design of colormaps. With such a suite, the users can observe the effects when different continuous colormaps are applied to planar scalar fields that may exhibit various characteristic features, such as jumps, local extrema, ridge or valley lines, different distributions of scalar values, different gradients, different signal frequencies, different levels of noise, and so on. The suite also includes an expansible collection of real-world data sets including the most popular data for colormap testing in the visualization literature. The test suite has been integrated into a web-based application for creating continuous colormaps (https://ccctool.com/), facilitating close inter-operation between design and evaluation processes. This new facility complements traditional evaluation methods such as user testimonies and empirical studies.},

keywords = {},

pubstate = {published},

tppubtype = {article}

}
Nardini, Pascal; Chen, Min; Samsel, Francesca; Bujack, Roxana; Bottinger, Michael; Scheuermann, Gerik
The making of continuous colormaps Journal Article
In: IEEE transactions on visualization and computer graphics, vol. 27, no. 6, pp. 3048–3063, 2019.
@article{nardini2019making,

title = {The making of continuous colormaps},

author = {Pascal Nardini and Min Chen and Francesca Samsel and Roxana Bujack and Michael Bottinger and Gerik Scheuermann},

url = {http://www.informatik.uni-leipzig.de/~bujack/2020ccc.pdf},

year  = {2019},

date = {2019-01-01},

urldate = {2019-01-01},

journal = {IEEE transactions on visualization and computer graphics},

volume = {27},

number = {6},

pages = {3048--3063},

publisher = {IEEE},

abstract = {Continuous colormaps are integral parts of many visualization techniques, such as heat-maps, surface plots, and flow visualization. Despite that the critiques of rainbow colormaps have been around and well-acknowledged for three decades, rainbow colormaps are still widely used today. One reason behind the resilience of rainbow colormaps is the lack of tools for users to create a continuous colormap that encodes semantics specific to the application concerned. In this paper, we present a web-based software system, CCC-Tool (short for Charting Continuous Colormaps) under the URL https://ccctool.com, for creating, editing, and analyzing such application-specific colormaps. We introduce the notion of “colormap specification (CMS)” that maintains the essential semantics required for defining a color mapping scheme. We provide users with a set of advanced utilities for constructing CMS’s with various levels of complexity, examining their quality attributes using different plots, and exporting them to external application software. We present two case studies, demonstrating that the CCC-Tool can help domain scientists as well as visualization experts in designing semantically-rich colormaps.},

keywords = {},

pubstate = {published},

tppubtype = {article}

}
Ware, Colin; Turton, Terece; Bujack, Roxana; Samsel, Francesca; Shrivastava, Piyush; Rogers, David
Measuring and Modeling the Feature Detection Threshold Functions of Colormaps Journal Article
In: IEEE Transactions on Visualization and Computer Graphics, pp. 1-1, 2018, ISSN: 1077-2626, (LA-UR-18-21476).
@article{8413174,

title = {Measuring and Modeling the Feature Detection Threshold Functions of Colormaps},

author = {Colin Ware and Terece Turton and Roxana Bujack and Francesca Samsel and Piyush Shrivastava and David Rogers},

url = {https://ieeexplore.ieee.org/document/8413174},

doi = {10.1109/TVCG.2018.2855742},

issn = {1077-2626},

year  = {2018},

date = {2018-01-01},

journal = {IEEE Transactions on Visualization and Computer Graphics},

pages = {1-1},

abstract = {Pseudocoloring is one of the most common techniques used in scientific visualization. To apply pseudocoloring to a scalar field, the field value at each point is represented using one of a sequence of colors (called a colormap). One of the principles applied in generating colormaps is uniformity and previously the main method for determining uniformity has been the application of uniform color spaces. Here we present a new method for evaluating the feature discrimination threshold function across a colormap. The method is used in crowdsourced studies for the direct evaluation of nine colormaps for three feature sizes. The results are used to test the hypothesis that a uniform color space (CIELAB) gives too much weight to chromatic differences compared to luminance differences because of the way it was constructed. The hypothesis that feature discrimination can be predicted solely on the basis of luminance is also tested. The results reject both hypotheses and we demonstrate how reduced weights on the green-red and blue-yellow terms of the CIELAB color space creates a more accurate model when the task is the detection of smaller features in colormapped data. Both the method itself and modified CIELAB can be used in colormap design and evaluation.},

note = {LA-UR-18-21476},

keywords = {},

pubstate = {published},

tppubtype = {article}

}
Samsel, Francesca; Klassen, Sebastian; Petersen, Mark; Turton, Terece; Abram, Greg; Rogers, David; Ahrens, James
Interactive Colormapping: Enabling Multiple Data Ranges, Detailed Views of Ocean Salinity Proceedings Article
In: Proceedings of the 34rd Annual ACM Conference Extended Abstracts on Human Factors in Computing Systems, ACM, San Jose, California, 2016, (LA-UR-15-20105).
@inproceedings{Samsel:2016:CIP:2702613.2702975,

title = {Interactive Colormapping: Enabling Multiple Data Ranges, Detailed Views of Ocean Salinity},

author = {Francesca Samsel and Sebastian Klassen and Mark Petersen and Terece Turton and Greg Abram and David Rogers and James Ahrens},

url = {http://datascience.dsscale.org/wp-content/uploads/2016/06/InteractiveColormapping.pdf},

year  = {2016},

date = {2016-01-01},

booktitle = {Proceedings of the 34rd Annual ACM Conference Extended Abstracts on Human Factors in Computing Systems},

publisher = {ACM},

address = {San Jose, California},

series = {CHI EA '16},

abstract = {Ocean salinity is a critical component to understanding climate change. Salinity concentrations and temperature drive large ocean currents which in turn drive global weather patterns. Melting ice caps lower salinity at the poles while river deltas bring fresh water into the ocean worldwide. These processes slow ocean currents, changing weather patterns and producing extreme climate events which disproportionally affect those living in poverty. Analysis of salinity presents a unique visualization challenge. Important data are found in narrow data ranges, varying with global location. Changing values of salinity are important in understanding ocean currents, but are difficult to map to colors using traditional tools. Commonly used colormaps may not provide sufficient detail for this data. Current editing tools do not easily enable a scientist to explore the subtleties of salinity. We present a workflow, enabled by an interactive colormap tool that allows a scientist to interactively apply sophisticated colormaps to scalar data. The intuitive and immediate interaction of the scientist with the data is a critical contribution of this work.},

note = {LA-UR-15-20105},

keywords = {},

pubstate = {published},

tppubtype = {inproceedings}

}
Samsel, Francesca; Petersen, Mark; Geld, Terece; Abram, Greg; Wendelberger, Joanne; Ahrens, James
Colormaps That Improve Perception of High-Resolution Ocean Data Proceedings Article
In: Proceedings of the 33rd Annual ACM Conference Extended Abstracts on Human Factors in Computing Systems, pp. 703–710, ACM, Seoul, Republic of Korea, 2015, ISBN: 978-1-4503-3146-3, (LA-UR-15-20105).
@inproceedings{Samsel:2015:CIP:2702613.2702975,

title = {Colormaps That Improve Perception of High-Resolution Ocean Data},

author = {Francesca Samsel and Mark Petersen and Terece Geld and Greg Abram and Joanne Wendelberger and James Ahrens},

url = {http://datascience.dsscale.org/wp-content/uploads/2016/06/ColormapsThatImprovePerceptionOfHigh-ResolutionOceanData.pdf},

doi = {10.1145/2702613.2702975},

isbn = {978-1-4503-3146-3},

year  = {2015},

date = {2015-01-01},

booktitle = {Proceedings of the 33rd Annual ACM Conference Extended Abstracts on Human Factors in Computing Systems},

pages = {703--710},

publisher = {ACM},

address = {Seoul, Republic of Korea},

series = {CHI EA '15},

abstract = {Scientists from the Climate, Ocean and Sea Ice Modeling Team (COSIM) at the Los Alamos National Laboratory (LANL) are interested in gaining a deeper understanding of three primary ocean currents: the Gulf Stream, the Kuroshio Current, and the Agulhas Current & Retroflection. To address these needs, visual artist Francesca Samsel teamed up with experts from the areas of computer science, climate science, statistics, and perceptual science. By engaging an artist specializing in color, we created colormaps that provide the ability to see greater detail in these high-resolution datasets. The new colormaps applied to the POP dataset enabled scientists to see areas of interest unclear using standard colormaps. Improvements in the perceptual range of color allowed scientists to highlight structures within specific ocean currents. Work with the COSIM team members drove development of nested colormaps which provide further detail to the scientists.},

note = {LA-UR-15-20105},

keywords = {},

pubstate = {published},

tppubtype = {inproceedings}

}