2016
Samsel, Francesca; Klassen, Sebastian; Petersen, Mark; Turton, Terece; Abram, Greg; Rogers, David; Ahrens, James
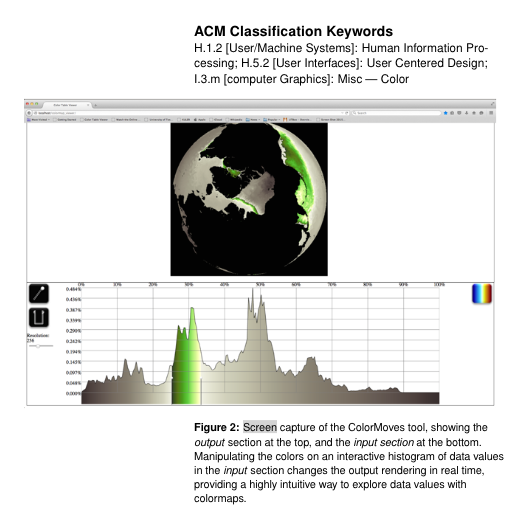
Interactive Colormapping: Enabling Multiple Data Ranges, Detailed Views of Ocean Salinity Proceedings Article
In: Proceedings of the 34rd Annual ACM Conference Extended Abstracts on Human Factors in Computing Systems, ACM, San Jose, California, 2016, (LA-UR-15-20105).
Abstract | Links | BibTeX | Tags: climate science, color perception, color theory, colormaps, high-resolution datasets, scientific visualization
@inproceedings{Samsel:2016:CIP:2702613.2702975,

title = {Interactive Colormapping: Enabling Multiple Data Ranges, Detailed Views of Ocean Salinity},

author = {Francesca Samsel and Sebastian Klassen and Mark Petersen and Terece Turton and Greg Abram and David Rogers and James Ahrens},

url = {http://datascience.dsscale.org/wp-content/uploads/2016/06/InteractiveColormapping.pdf},

year  = {2016},

date = {2016-01-01},

booktitle = {Proceedings of the 34rd Annual ACM Conference Extended Abstracts on Human Factors in Computing Systems},

publisher = {ACM},

address = {San Jose, California},

series = {CHI EA '16},

abstract = {Ocean salinity is a critical component to understanding climate change. Salinity concentrations and temperature drive large ocean currents which in turn drive global weather patterns. Melting ice caps lower salinity at the poles while river deltas bring fresh water into the ocean worldwide. These processes slow ocean currents, changing weather patterns and producing extreme climate events which disproportionally affect those living in poverty. Analysis of salinity presents a unique visualization challenge. Important data are found in narrow data ranges, varying with global location. Changing values of salinity are important in understanding ocean currents, but are difficult to map to colors using traditional tools. Commonly used colormaps may not provide sufficient detail for this data. Current editing tools do not easily enable a scientist to explore the subtleties of salinity. We present a workflow, enabled by an interactive colormap tool that allows a scientist to interactively apply sophisticated colormaps to scalar data. The intuitive and immediate interaction of the scientist with the data is a critical contribution of this work.},

note = {LA-UR-15-20105},

keywords = {climate science, color perception, color theory, colormaps, high-resolution datasets, scientific visualization},

pubstate = {published},

tppubtype = {inproceedings}

}
2015
Samsel, Francesca; Petersen, Mark; Geld, Terece; Abram, Greg; Wendelberger, Joanne; Ahrens, James
Colormaps That Improve Perception of High-Resolution Ocean Data Proceedings Article
In: Proceedings of the 33rd Annual ACM Conference Extended Abstracts on Human Factors in Computing Systems, pp. 703–710, ACM, Seoul, Republic of Korea, 2015, ISBN: 978-1-4503-3146-3, (LA-UR-15-20105).
Abstract | Links | BibTeX | Tags: climate science, color perception, color theory, colormaps, high-resolution datasets, scientific visualization
@inproceedings{Samsel:2015:CIP:2702613.2702975,

title = {Colormaps That Improve Perception of High-Resolution Ocean Data},

author = {Francesca Samsel and Mark Petersen and Terece Geld and Greg Abram and Joanne Wendelberger and James Ahrens},

url = {http://datascience.dsscale.org/wp-content/uploads/2016/06/ColormapsThatImprovePerceptionOfHigh-ResolutionOceanData.pdf},

doi = {10.1145/2702613.2702975},

isbn = {978-1-4503-3146-3},

year  = {2015},

date = {2015-01-01},

booktitle = {Proceedings of the 33rd Annual ACM Conference Extended Abstracts on Human Factors in Computing Systems},

pages = {703--710},

publisher = {ACM},

address = {Seoul, Republic of Korea},

series = {CHI EA '15},

abstract = {Scientists from the Climate, Ocean and Sea Ice Modeling Team (COSIM) at the Los Alamos National Laboratory (LANL) are interested in gaining a deeper understanding of three primary ocean currents: the Gulf Stream, the Kuroshio Current, and the Agulhas Current & Retroflection. To address these needs, visual artist Francesca Samsel teamed up with experts from the areas of computer science, climate science, statistics, and perceptual science. By engaging an artist specializing in color, we created colormaps that provide the ability to see greater detail in these high-resolution datasets. The new colormaps applied to the POP dataset enabled scientists to see areas of interest unclear using standard colormaps. Improvements in the perceptual range of color allowed scientists to highlight structures within specific ocean currents. Work with the COSIM team members drove development of nested colormaps which provide further detail to the scientists.},

note = {LA-UR-15-20105},

keywords = {climate science, color perception, color theory, colormaps, high-resolution datasets, scientific visualization},

pubstate = {published},

tppubtype = {inproceedings}

}
Samsel, Francesca; Klassen, Sebastian; Petersen, Mark; Turton, Terece; Abram, Greg; Rogers, David; Ahrens, James
Interactive Colormapping: Enabling Multiple Data Ranges, Detailed Views of Ocean Salinity Proceedings Article
In: Proceedings of the 34rd Annual ACM Conference Extended Abstracts on Human Factors in Computing Systems, ACM, San Jose, California, 2016, (LA-UR-15-20105).
@inproceedings{Samsel:2016:CIP:2702613.2702975,

title = {Interactive Colormapping: Enabling Multiple Data Ranges, Detailed Views of Ocean Salinity},

author = {Francesca Samsel and Sebastian Klassen and Mark Petersen and Terece Turton and Greg Abram and David Rogers and James Ahrens},

url = {http://datascience.dsscale.org/wp-content/uploads/2016/06/InteractiveColormapping.pdf},

year  = {2016},

date = {2016-01-01},

booktitle = {Proceedings of the 34rd Annual ACM Conference Extended Abstracts on Human Factors in Computing Systems},

publisher = {ACM},

address = {San Jose, California},

series = {CHI EA '16},

abstract = {Ocean salinity is a critical component to understanding climate change. Salinity concentrations and temperature drive large ocean currents which in turn drive global weather patterns. Melting ice caps lower salinity at the poles while river deltas bring fresh water into the ocean worldwide. These processes slow ocean currents, changing weather patterns and producing extreme climate events which disproportionally affect those living in poverty. Analysis of salinity presents a unique visualization challenge. Important data are found in narrow data ranges, varying with global location. Changing values of salinity are important in understanding ocean currents, but are difficult to map to colors using traditional tools. Commonly used colormaps may not provide sufficient detail for this data. Current editing tools do not easily enable a scientist to explore the subtleties of salinity. We present a workflow, enabled by an interactive colormap tool that allows a scientist to interactively apply sophisticated colormaps to scalar data. The intuitive and immediate interaction of the scientist with the data is a critical contribution of this work.},

note = {LA-UR-15-20105},

keywords = {},

pubstate = {published},

tppubtype = {inproceedings}

}
Samsel, Francesca; Petersen, Mark; Geld, Terece; Abram, Greg; Wendelberger, Joanne; Ahrens, James
Colormaps That Improve Perception of High-Resolution Ocean Data Proceedings Article
In: Proceedings of the 33rd Annual ACM Conference Extended Abstracts on Human Factors in Computing Systems, pp. 703–710, ACM, Seoul, Republic of Korea, 2015, ISBN: 978-1-4503-3146-3, (LA-UR-15-20105).
@inproceedings{Samsel:2015:CIP:2702613.2702975,

title = {Colormaps That Improve Perception of High-Resolution Ocean Data},

author = {Francesca Samsel and Mark Petersen and Terece Geld and Greg Abram and Joanne Wendelberger and James Ahrens},

url = {http://datascience.dsscale.org/wp-content/uploads/2016/06/ColormapsThatImprovePerceptionOfHigh-ResolutionOceanData.pdf},

doi = {10.1145/2702613.2702975},

isbn = {978-1-4503-3146-3},

year  = {2015},

date = {2015-01-01},

booktitle = {Proceedings of the 33rd Annual ACM Conference Extended Abstracts on Human Factors in Computing Systems},

pages = {703--710},

publisher = {ACM},

address = {Seoul, Republic of Korea},

series = {CHI EA '15},

abstract = {Scientists from the Climate, Ocean and Sea Ice Modeling Team (COSIM) at the Los Alamos National Laboratory (LANL) are interested in gaining a deeper understanding of three primary ocean currents: the Gulf Stream, the Kuroshio Current, and the Agulhas Current & Retroflection. To address these needs, visual artist Francesca Samsel teamed up with experts from the areas of computer science, climate science, statistics, and perceptual science. By engaging an artist specializing in color, we created colormaps that provide the ability to see greater detail in these high-resolution datasets. The new colormaps applied to the POP dataset enabled scientists to see areas of interest unclear using standard colormaps. Improvements in the perceptual range of color allowed scientists to highlight structures within specific ocean currents. Work with the COSIM team members drove development of nested colormaps which provide further detail to the scientists.},

note = {LA-UR-15-20105},

keywords = {},

pubstate = {published},

tppubtype = {inproceedings}

}