2022
Bujack, Roxana
Discussion and Visualization of Distinguished Hyperbolic Trajectories as a Generalization of Critical Points to 2D Time-dependent Flow Proceedings Article
In: 2022 Topological Data Analysis and Visualization (TopoInVis), pp. 59-69, 2022.
Abstract | Links | BibTeX | Tags: flow, Topology, Vector field, visualization
@inproceedings{9975815,
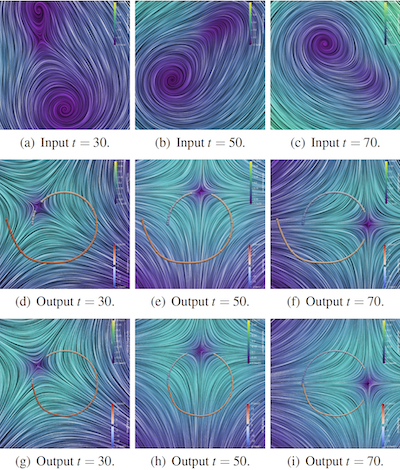
title = {Discussion and Visualization of Distinguished Hyperbolic Trajectories as a Generalization of Critical Points to 2D Time-dependent Flow},
author = {Roxana Bujack},
url = {http://www.informatik.uni-leipzig.de/~bujack/2022topoInVis.pdf},
doi = {10.1109/TopoInVis57755.2022.00013},
year = {2022},
date = {2022-01-01},
urldate = {2022-01-01},
booktitle = {2022 Topological Data Analysis and Visualization (TopoInVis)},
pages = {59-69},
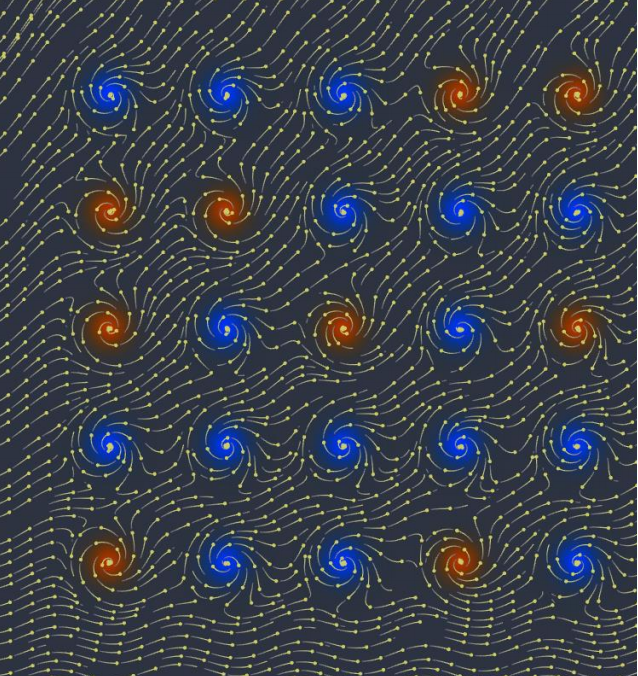
abstract = {Classical vector field topology has proven to be a useful visualization technique for steady flow, but its straightforward application to time-dependent flows lacks physical meaning. Necessary requirements for physical meaningfulness include the results to be objective, i.e., independent of the frame of reference of the observer, and Lagrangian, i.e., that the generalized critical points are trajectories. We analyze whether the theoretical concept of distinguished hyperbolic trajectories provides a physically meaningful generalization to classical critical points and if the existing extraction algorithms correctly compute what has been defined mathematically. We show that both theory and algorithms constitute a significant improvement over previous methods.We further present a method to visualize a time-dependent flow field in the reference frames of distinguished trajectories. The result is easy to interpret because it makes these trajectories look like classical critical points for each instance in time, but it is meaningful because it is Lagrangian and objective.},
keywords = {flow, Topology, Vector field, visualization},
pubstate = {published},
tppubtype = {inproceedings}
}
2018
Abram, Greg; Navrátil, Paul; Grossett, Pascal; Rogers, David; Ahrens, James
Galaxy: Asynchronous Ray Tracing for Large High-Fidelity Visualization Proceedings Article
In: 2018 IEEE 8th Symposium on Large Data Analysis and Visualization (LDAV), pp. 72-76, 2018, ISSN: null, (LA-UR-18-26088).
Abstract | Links | BibTeX | Tags: computer graphics, human-centered computing, ray tracing, rendering, visualization
@inproceedings{8739241,
title = {Galaxy: Asynchronous Ray Tracing for Large High-Fidelity Visualization},
author = {Greg Abram and Paul Navrátil and Pascal Grossett and David Rogers and James Ahrens},
doi = {10.1109/LDAV.2018.8739241},
issn = {null},
year = {2018},
date = {2018-10-01},
booktitle = {2018 IEEE 8th Symposium on Large Data Analysis and Visualization (LDAV)},
pages = {72-76},
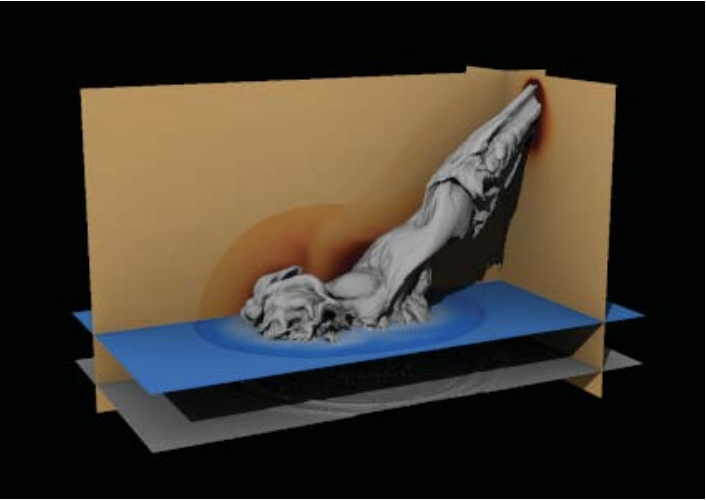
abstract = {We present Galaxy, a fully asynchronous distributed parallel rendering engine geared towards using full global illumination for large-scale visualization. Galaxy provides performant distributed rendering of complex lighting and material models, particularly those that require ray traversal across nodes. Our design is favorable for tightly-coupled in situ scenarios, where data remains on simulation nodes. By employing asynchronous framebuffer updates and a novel subtractive lighting model, we achieve acceptable image quality from the first ray generation, and improve quality throughout the render epoch. On simulated in situ rendering tasks, Galaxy outperforms the current best-of-breed scientific ray tracer by over 3× for distributed geometric and particle data, while providing expanded rendering capability for global illumination and complex materials.},
note = {LA-UR-18-26088},
keywords = {computer graphics, human-centered computing, ray tracing, rendering, visualization},
pubstate = {published},
tppubtype = {inproceedings}
}
Vogel, Sven; Biwer, Chris; Rogers, David; Ahrens, James; Hackenberg, Robert; Onken, Drew; Zhang, Jianzhong
Interactive visualization of multi-data-set Rietveld analyses using Cinema:Debye-Scherrer Journal Article
In: Journal of Applied Crystallography, vol. 51, no. 3, pp. 943–951, 2018.
Abstract | Links | BibTeX | Tags: automated analysis, diffraction data analysis, visualization
@article{Vogel:ks5597,
title = {Interactive visualization of multi-data-set Rietveld analyses using \textit{Cinema:Debye-Scherrer}},
author = {Sven Vogel and Chris Biwer and David Rogers and James Ahrens and Robert Hackenberg and Drew Onken and Jianzhong Zhang},
url = {https://doi.org/10.1107/S1600576718003989},
doi = {10.1107/S1600576718003989},
year = {2018},
date = {2018-06-01},
journal = {Journal of Applied Crystallography},
volume = {51},
number = {3},
pages = {943--951},
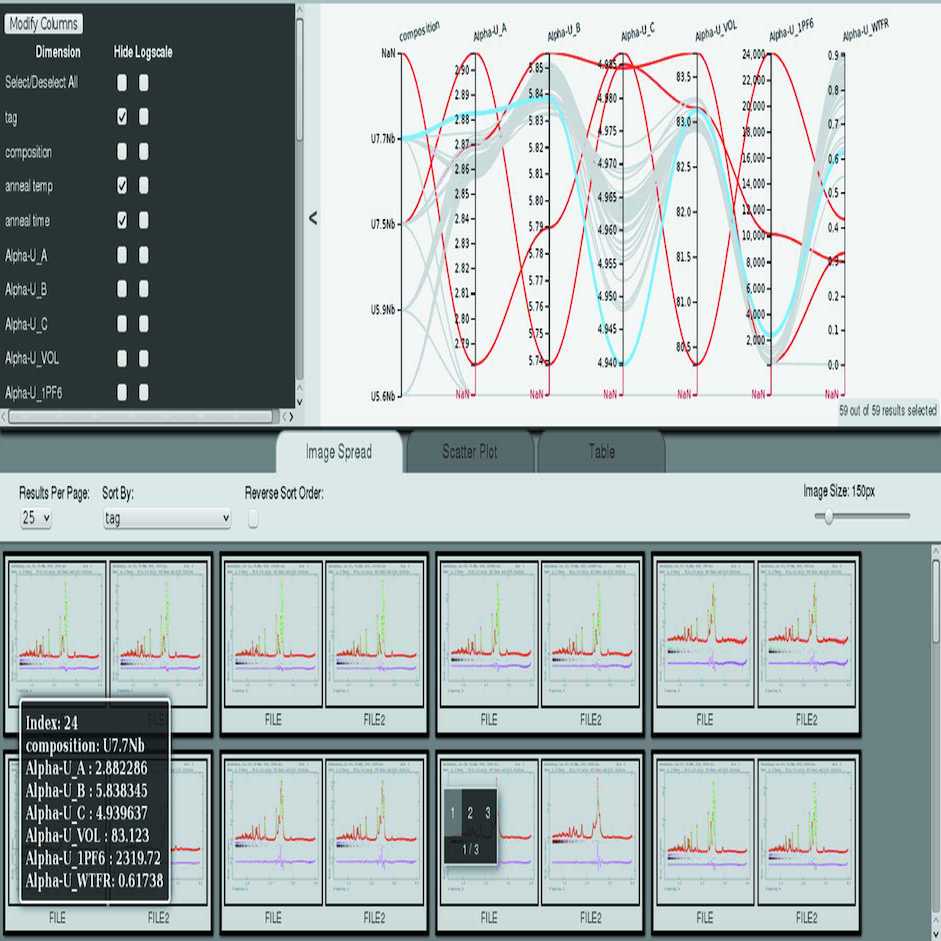
abstract = {A tool named \textit{Cinema:Debye-Scherrer} to visualize the results of a series of Rietveld analyses is presented. The multi-axis visualization of the high-dimensional data sets resulting from powder diffraction analyses allows identification of analysis problems, prediction of suitable starting values, identification of gaps in the experimental parameter space and acceleration of scientific insight from the experimental data. The tool is demonstrated with analysis results from 59 U—Nb alloy samples with different compositions, annealing times and annealing temperatures as well as with a high-temperature study of the crystal structure of CsPbBr_{3}. A script to extract parameters from a series of Rietveld analyses employing the widely used \textit{GSAS} Rietveld software is also described. Both software tools are available for download.},
keywords = {automated analysis, diffraction data analysis, visualization},
pubstate = {published},
tppubtype = {article}
}
Zeyen, Max; Post, Tobias; Hagen, Hans; Ahrens, James; Rogers, David; Bujack, Roxana
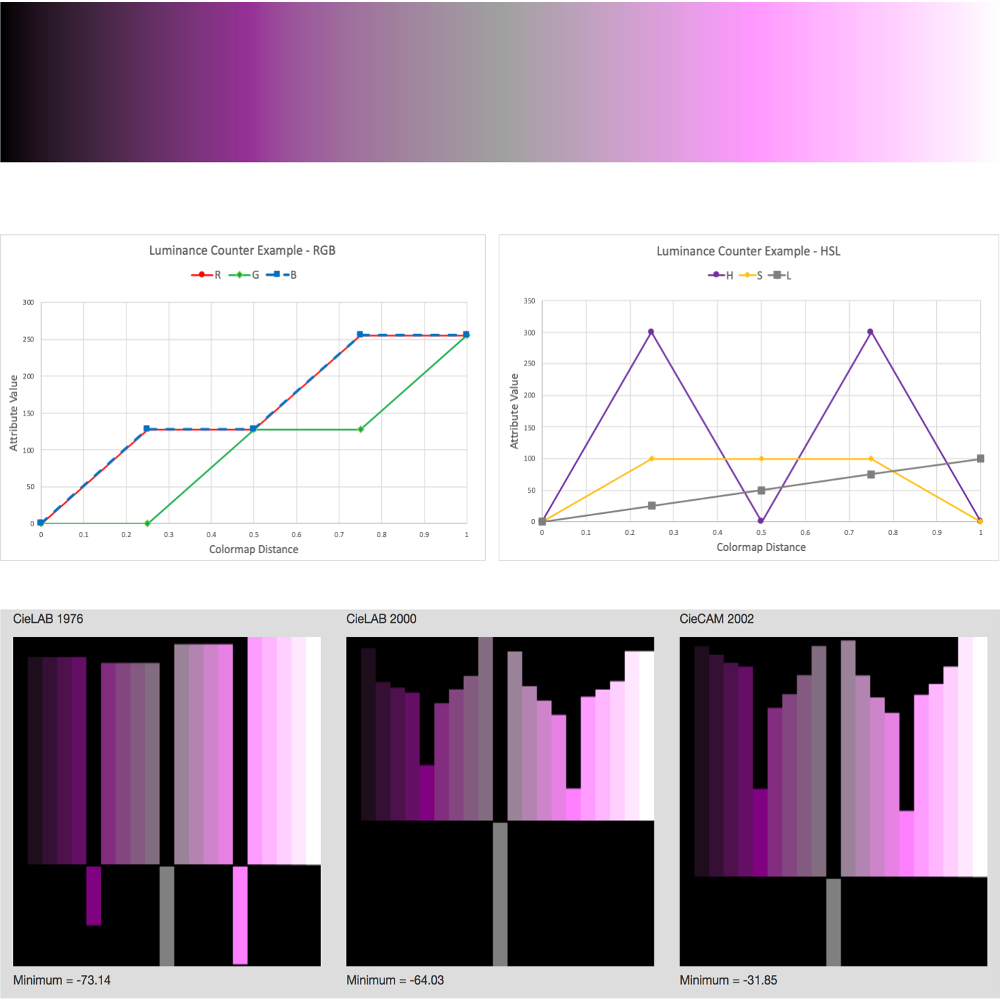
Color Interpolation for Non-Euclidean Color Spaces Proceedings Article
In: IEEE Scientific Visualization Conference (SciVis) Short Papers, IEEE, 2018.
Abstract | Links | BibTeX | Tags: visualization, visualization techniques
@inproceedings{zeyen2018interpolation,
title = {Color Interpolation for Non-Euclidean Color Spaces},
author = {Max Zeyen and Tobias Post and Hans Hagen and James Ahrens and David Rogers and Roxana Bujack},
url = {https://datascience.dsscale.org/wp-content/uploads/2019/01/ColorInterpolationforNon-EuclideanColorSpaces.pdf},
year = {2018},
date = {2018-01-01},
booktitle = {IEEE Scientific Visualization Conference (SciVis) Short Papers},
publisher = {IEEE},
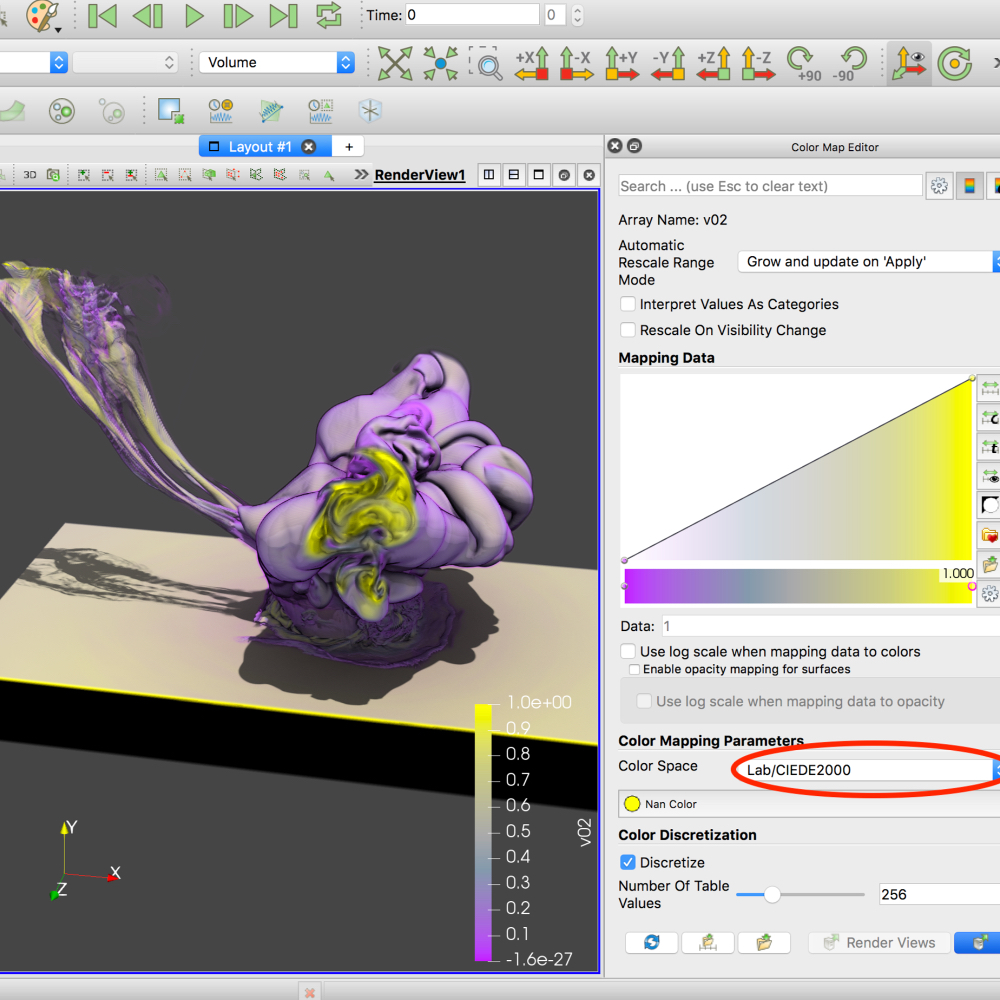
abstract = {Color interpolation is critical to many applications across a variety of domains, like color mapping or image processing. Due to the characteristics of the human visual system, color spaces whose distance measure is designed to mimic perceptual color differences tend to be non-Euclidean. In this setting, a generalization of established interpolation schemes is not trivial. This paper presents an approach to generalize linear interpolation to colors for color spaces equipped with an arbitrary non-Euclidean distance measure. It makes use of the fact that in Euclidean spaces, a straight line coincides with the shortest path between two points. Additionally, we provide an interactive implementation of our method for the CIELAB color space using the CIEDE2000 distance measure integrated into VTK and ParaView.},
keywords = {visualization, visualization techniques},
pubstate = {published},
tppubtype = {inproceedings}
}
Bujack, Roxana; Turton, Terece; Rogers, David; Ahrens, James
Ordering Perceptions about Perceptual Order Proceedings Article
In: IEEE Scientific Visualization Conference (SciVis) Short Papers, IEEE, 2018.
Abstract | Links | BibTeX | Tags: visualization, visualization techniques
@inproceedings{bujack2018ordering,

title = {Ordering Perceptions about Perceptual Order},

author = {Roxana Bujack and Terece Turton and David Rogers and James Ahrens},

url = {https://datascience.dsscale.org/wp-content/uploads/2019/01/OrderingPerceptionsaboutPerceptualOrder.pdf},

year  = {2018},

date = {2018-01-01},

booktitle = {IEEE Scientific Visualization Conference (SciVis) Short Papers},

publisher = {IEEE},

abstract = {One of the most important properties that inherently defines a good colormap is perceptual order. In the literature, we find a wide range of recommendations and hypotheses regarding order. Properties such as monotonicity in luminance, saturation, or hue are/are not stated as necessary/sufficient to ensure perceptual order. In this paper, we gather the most common statements about perceptual order and, when possible, prove or disprove them.},

keywords = {visualization, visualization techniques},

pubstate = {published},

tppubtype = {inproceedings}

}
2017
Yang, Bo; Kostkova, Jitka; Flusser, Jan; Suk, Tomas; Bujack, Roxana
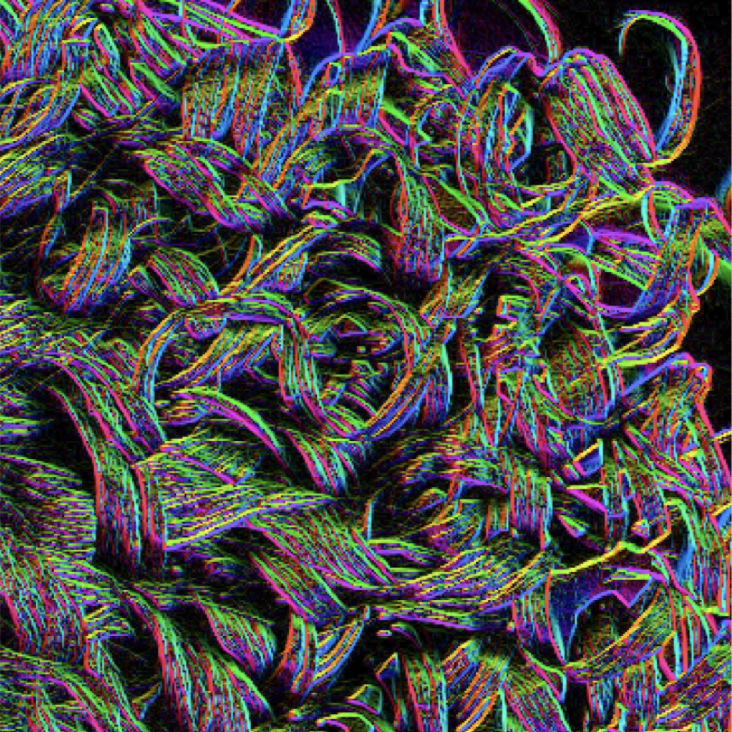
Rotation Invariants of Vector Fields from Orthogonal Moments Journal Article
In: Pattern Recognition, no. Supplement C, pp. 110 - 121, 2017, ISSN: 0031-3203, (LA-UR-17-26797, Under a Creative Comms license: http://creativecommons.org/licenses/by-nc-nd/4.0/).
Abstract | Links | BibTeX | Tags: Numerical stability, visualization
@article{yang2017rotation,

title = {Rotation Invariants of Vector Fields from Orthogonal Moments},

author = {Bo Yang and Jitka Kostkova and Jan Flusser and Tomas Suk and Roxana Bujack},

url = {http://datascience.dsscale.org/wp-content/uploads/2017/09/LA-UR-17-26797.pdf},

doi = {10.1016/j.patcog.2017.09.004},

issn = {0031-3203},

year  = {2017},

date = {2017-09-11},

booktitle = {Pattern Recognition},

journal = {Pattern Recognition},

number = {Supplement C},

pages = {110 - 121},

abstract = {Abstract Vector field images are a type of new multidimensional data that appear in many engineering areas. Although the vector fields can be visualized as images, they differ from graylevel and color images in several aspects. To analyze them, special methods and algorithms must be originally developed or substantially adapted from the traditional image processing area. In this paper, we propose a method for the description and matching of vector field patterns under an unknown rotation of the field. Rotation of a vector field is so-called total rotation, where the action is applied not only on the spatial coordinates but also on the field values. Invariants of vector fields with respect to total rotation constructed from orthogonal Gaussian--Hermite moments and Zernike moments are introduced. Their numerical stability is shown to be better than that of the invariants published so far. We demonstrate their usefulness in a real world template matching application of rotated vector fields.},

note = {LA-UR-17-26797, Under a Creative Comms license: http://creativecommons.org/licenses/by-nc-nd/4.0/},

keywords = {Numerical stability, visualization},

pubstate = {published},

tppubtype = {article}

}
Berres, Anne; Adhinarayanan, Vignesh; Turton, Terece; Feng, Wu; Rogers, David
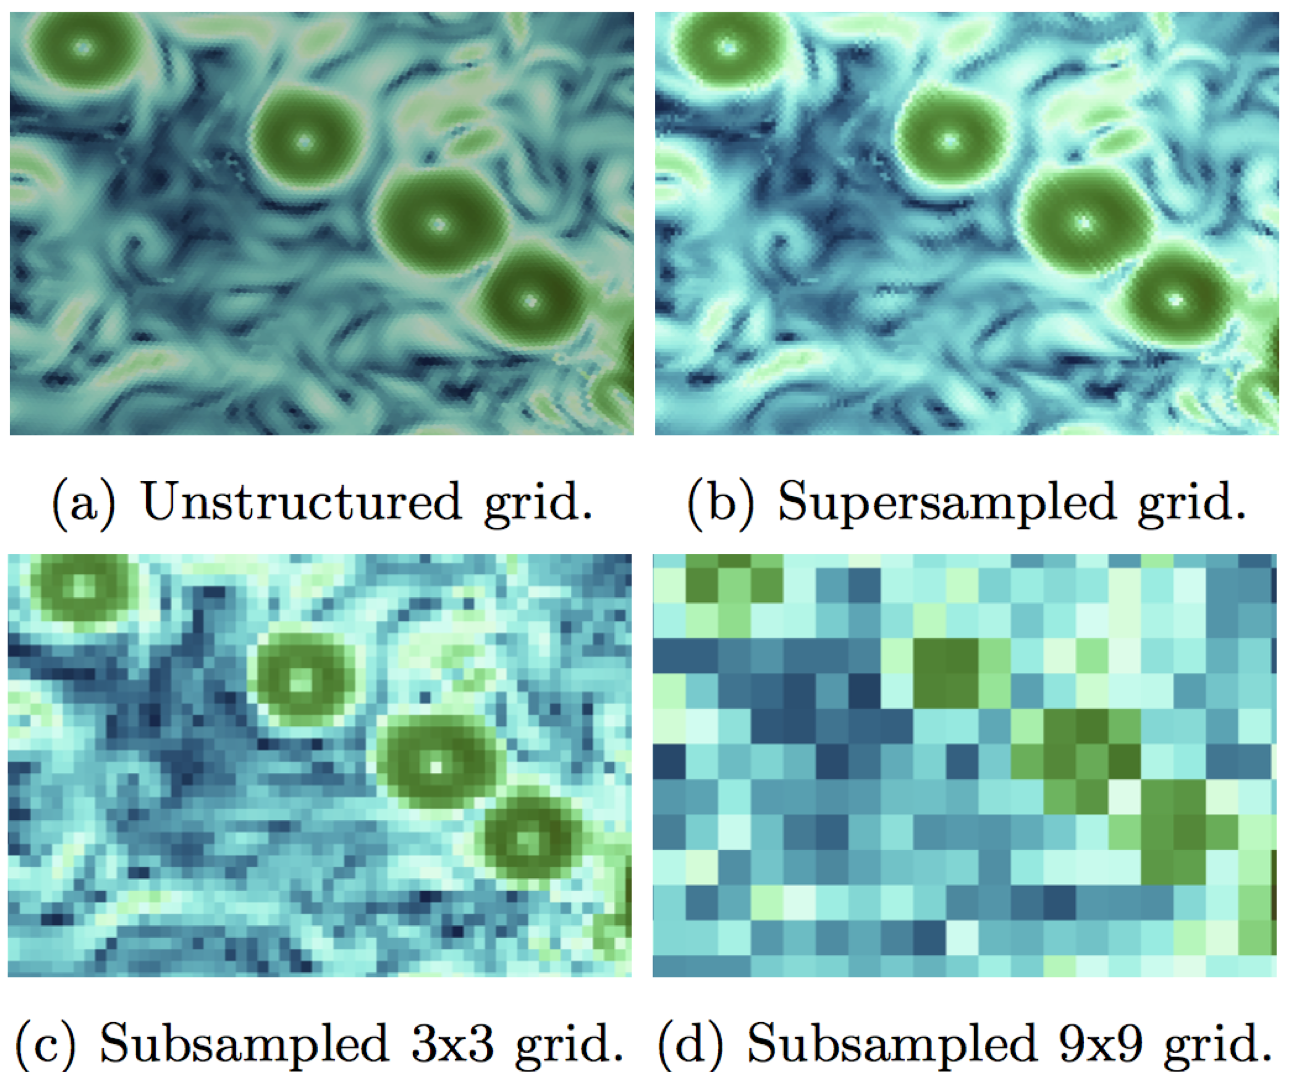
A Pipeline for Large Data Processing Using Regular Sampling for Unstructured Grids Proceedings Article
In: 2017, (LA-UR-17-23903).
Abstract | Links | BibTeX | Tags: large-scale data, visualization
@inproceedings{info:lanl-repo/lareport/LA-UR-17-23903,

title = {A Pipeline for Large Data Processing Using Regular Sampling for Unstructured Grids},

author = {Anne Berres and Vignesh Adhinarayanan and Terece Turton and Wu Feng and David Rogers},

url = {http://datascience.dsscale.org/wp-content/uploads/2017/08/LA-UR-17-23903.pdf},

year  = {2017},

date = {2017-05-12},

abstract = {Large simulation data requires a lot of time and computational resources to compute, store, analyze, visualize, and run user studies. Today, the largest cost of a supercomputer is not hardware but maintenance, in particular energy consumption. Our goal is to balance energy consumption and cognitive value of visualizations of resulting data. This requires us to go through the entire processing pipeline, from simulation to user studies. To reduce the amount of resources, data can be sampled or compressed. While this adds more computation time, the computational overhead is negligible compared to the simulation time. We built a processing pipeline at the example of regular sampling. The reasons for this choice are two-fold: using a simple example reduces unnecessary complexity as we know what to expect from the results. Furthermore, it provides a good baseline for future, more elaborate sampling methods. We measured time and energy for each test we did, and we conducted user studies in Amazon Mechanical Turk (AMT) for a range of different results we produced through sampling.

},

note = {LA-UR-17-23903},

keywords = {large-scale data, visualization},

pubstate = {published},

tppubtype = {inproceedings}

}
Banesh, Divya; Schoonover, Joseph; Ahrens, James; Hamann, Bernd
Extracting, Visualizing and Tracking Mesoscale Ocean Eddies in Two-dimensional Image Sequences Using Contours and Moments Proceedings Article
In: 2017, (Workshop on Visualisation in Environmental Sciences (EnvirVis), LA-UR-17-21623).
Abstract | Links | BibTeX | Tags: contours, moments, visualization
@inproceedings{Authors2017,

title = {Extracting, Visualizing and Tracking Mesoscale Ocean Eddies in Two-dimensional Image Sequences Using Contours and Moments},

author = {Divya Banesh and Joseph Schoonover and James Ahrens and Bernd Hamann},

url = {http://datascience.dsscale.org/wp-content/uploads/2017/08/ExtractingVisualizingandTrackingMesoscaleOceanEddiesinTwo-dimensionalImageSequencesUsingContoursandMoments.pdf},

year  = {2017},

date = {2017-03-31},

abstract = {We introduce a system for the extraction and tracking of mesoscale eddies captured in massive global ocean simulations. The major strength and contribution of our system is its design, which is based on two-dimensional image data processing. The Cinema database [CD] makes possible the generation and storage of two-dimensional image data taken in-situ, i.e., the creation of images via a virtual camera generating images during the ongoing simulation. The problem of eddy extraction and tracking is simplified by our approach to the problem of finding, matching and tracking eddies in two-dimensional images, thus eliminating the task of processing the original massive three-dimensional data set. Our system can be used on a simple desktop computer and provides an intuitive interface allowing a scientist to perform an eddy analysis for global ocean data in real-time. We demonstrate the effectiveness of our implementation for a specific simulated data set.},

note = {Workshop on Visualisation in Environmental Sciences (EnvirVis), LA-UR-17-21623},

keywords = {contours, moments, visualization},

pubstate = {published},

tppubtype = {inproceedings}

}
Hamilton, Stephen; Burns, Randal; Meneveau, Charles; Johnson, Perry; Lindstrom, Peter; Patchett, John; Szalay, Alexander S.
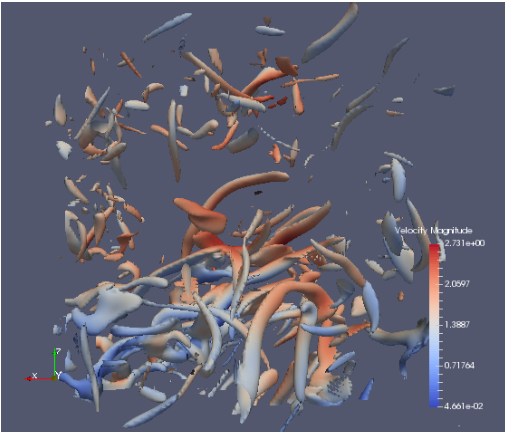
Extreme Event Analysis in Next Generation Simulation Architectures Proceedings Article
In: Kunkel, Julian M.; Yokota, Rio; Balaji, Pavan; Keyes, David (Ed.): High Performance Computing: 32nd International Conference, ISC High Performance 2017, Frankfurt, Germany, June 18--22, 2017, Proceedings, pp. 277–293, Springer, Cham Springer International Publishing}, 2017, ISBN: 978-3-319-58667-0.
Abstract | Links | BibTeX | Tags: in situ, visualization
@inproceedings{hamilton2017extreme,
title = {Extreme Event Analysis in Next Generation Simulation Architectures},
author = {Stephen Hamilton and Randal Burns and Charles Meneveau and Perry Johnson and Peter Lindstrom and John Patchett and Alexander S. Szalay},
editor = {Julian M. Kunkel and Rio Yokota and Pavan Balaji and David Keyes},
url = {http://datascience.dsscale.org/wp-content/uploads/2017/08/ExtremeEventAnalysisinNextGenerationSimulationArchitectures.pdf},
doi = {10.1007/978-3-319-58667-0_15},
isbn = {978-3-319-58667-0},
year = {2017},
date = {2017-01-01},
booktitle = {High Performance Computing: 32nd International Conference, ISC High Performance 2017, Frankfurt, Germany, June 18--22, 2017, Proceedings},
pages = {277--293},
publisher = {Springer International Publishing}},
organization = {Springer, Cham},
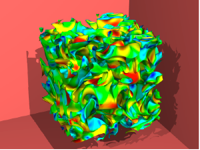
abstract = {Numerical simulations present challenges because they generate petabyte-scale data that must be extracted and reduced during the simulation. We demonstrate a seamless integration of feature extraction for a simulation of turbulent fluid dynamics. The simulation produces on the order of 6 terabytes per timestep. In order to analyze and store this data, we extract velocity data from a dilated volume of the strong vortical regions and also store a lossy compressed representation of the data. Both reduce data by one or more orders of magnitude. We extract data from user checkpoints in transit while they reside on temporary burst buffer SSD stores. In this way, analysis and compression algorithms are designed to meet specific time constraints so they do not interfere with simulation computations. Our results demonstrate that we can perform feature extraction on a world-class direct numerical simulation of turbulence while it is running and gather meaningful scientific data for archival and post analysis.},
keywords = {in situ, visualization},
pubstate = {published},
tppubtype = {inproceedings}
}
Berres, Anne; Turton, Terece; Rogers, David; Ahrens, James; Petersen, Mark
Video Compression for Ocean Simulation Image Databases Proceedings Article
In: Rink, Karsten; Middel, Ariane; Zeckzer, Dirk; Bujack, Roxana (Ed.): Workshop on Visualization in Environmental Sciences (EnvirVis), The Eurographics Association, 2017, ISBN: 978-3-03868-040-6, (LA-UR-17-21590).
Abstract | Links | BibTeX | Tags: compression, visualization
@inproceedings{info:lanl-repo/lareport/LA-UR-17-21590,

title = {Video Compression for Ocean Simulation Image Databases},

author = {Anne Berres and Terece Turton and David Rogers and James Ahrens and Mark Petersen},

editor = {Karsten Rink and Ariane Middel and Dirk Zeckzer and Roxana Bujack},

url = {http://datascience.dsscale.org/wp-content/uploads/2017/08/VideoCompressionforOceanSimulationImageDatabases.pdf},

doi = {10.2312/envirvis.20171104},

isbn = {978-3-03868-040-6},

year  = {2017},

date = {2017-01-01},

booktitle = {Workshop on Visualization in Environmental Sciences (EnvirVis)},

publisher = {The Eurographics Association},

abstract = {Climate research requires monitoring a large range of spatial and temporal scales to understand the climate system and potential future impacts. Climate simulations are now run with very high resolution (1–10 km gridcells) ocean, sea ice, and atmosphere components, and can easily produce petabytes of output. This overloads storage systems and hinders visualization and analysis. Image databases can decrease storage sizes from petabytes of simulation output down to several hundred gigabytes of images.

In this paper, we introduce video compression as a method to further decrease database sizes by 2-4 orders of magnitude. We compare compression and access speeds, compressed sizes, and compression quality over a range of settings. Quality is assessed through image quality metrics and expert feedback. Overall, we were able to show that video compression techniques provide an efficient means of storing image databases at a shareable size, while preserving image quality. This enables the wise use of available disk space, so scientists can more easily study the physical features of interest.},

howpublished = {Visualization in Environmental Sciences 2017 ; 2017-06-12 - 2017-06-13 ; Barcelona, Spain},

note = {LA-UR-17-21590},

keywords = {compression, visualization},

pubstate = {published},

tppubtype = {inproceedings}

}
In this paper, we introduce video compression as a method to further decrease database sizes by 2-4 orders of magnitude. We compare compression and access speeds, compressed sizes, and compression quality over a range of settings. Quality is assessed through image quality metrics and expert feedback. Overall, we were able to show that video compression techniques provide an efficient means of storing image databases at a shareable size, while preserving image quality. This enables the wise use of available disk space, so scientists can more easily study the physical features of interest.
Ware, Colin; Turton, Terece; Samsel, Francesca; Bujack, Roxana; Rogers, David
Evaluating the Perceptual Uniformity of Color Sequences for Feature Discrimination Proceedings Article
In: Lawonn, Kai; Smit, Noeska; Cunningham, Douglas (Ed.): EuroVis Workshop on Reproducibility, Verification, and Validation in Visualization (EuroRV3), The Eurographics Association, 2017, ISBN: 978-3-03868-041-3, (LA-UR-17-24206).
Abstract | Links | BibTeX | Tags: colormaps, visualization
@inproceedings{eurorv3.20171107,
title = {Evaluating the Perceptual Uniformity of Color Sequences for Feature Discrimination},
author = {Colin Ware and Terece Turton and Francesca Samsel and Roxana Bujack and David Rogers},
editor = {Kai Lawonn and Noeska Smit and Douglas Cunningham},
url = {https://diglib.eg.org/handle/10.2312/eurorv320171107},
isbn = {978-3-03868-041-3},
year = {2017},
date = {2017-01-01},
booktitle = {EuroVis Workshop on Reproducibility, Verification, and Validation in Visualization (EuroRV3)},
publisher = {The Eurographics Association},
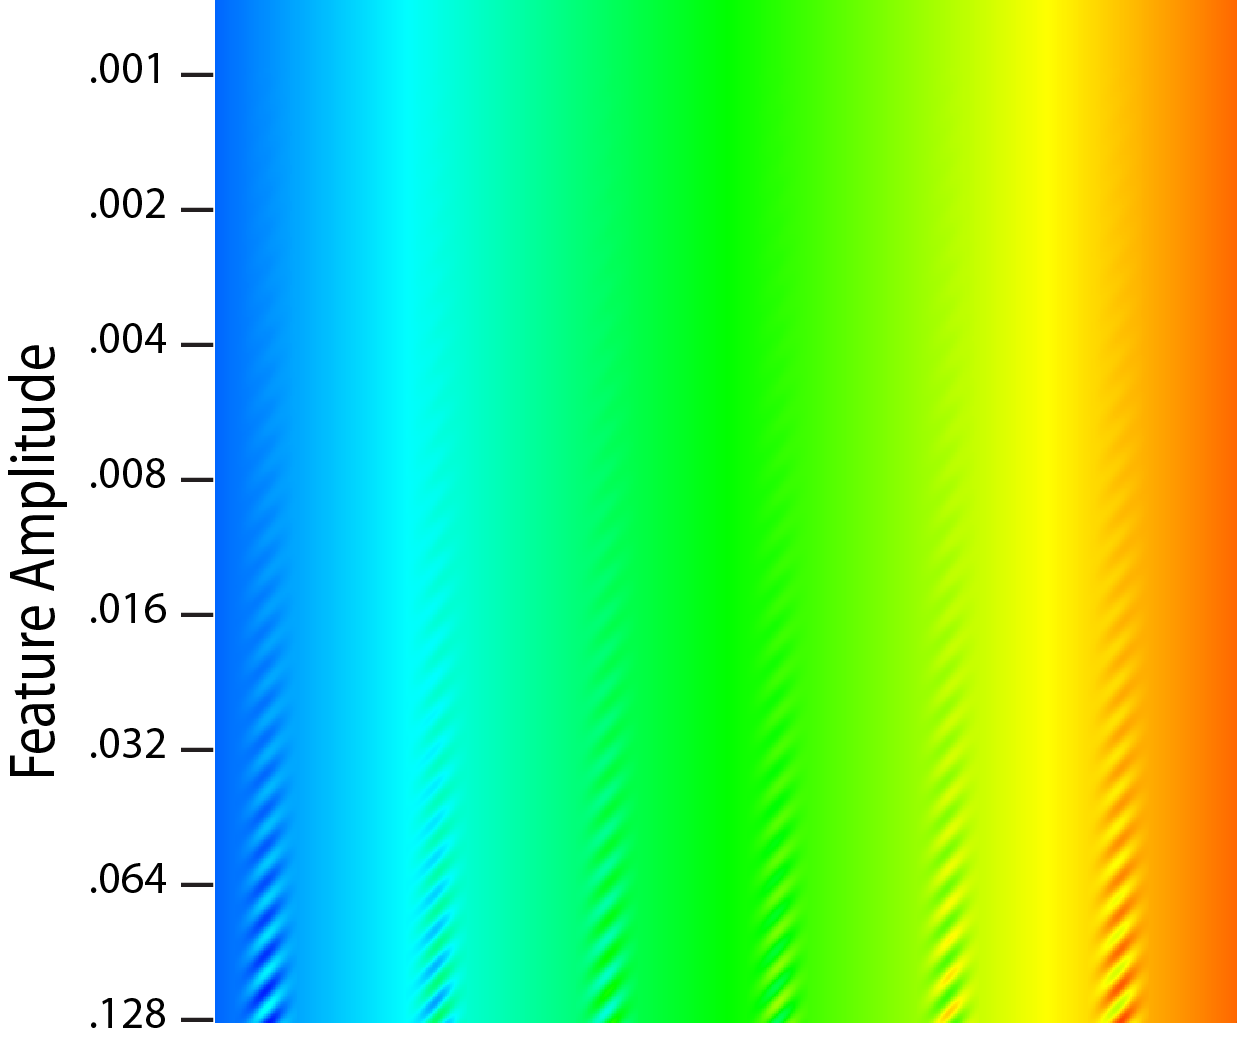
abstract = {Probably the most common method for visualizing univariate data maps is through pseudocoloring and one of the most commonly cited requirements of a good colormap is that it be perceptually uniform. This means that differences between adjacent colors in the sequence be equally distinct. The practical value of uniformity is for features in the data to be equally distinctive no matter where they lie in the colormap, but there are reasons for thinking that uniformity in terms of feature detection may not be achieved by current methods which are based on the use of uniform color spaces. In this paper we provide a new method for directly evaluating colormaps in terms of their capacity for feature resolution. We apply the method in a study using Amazon Mechanical Turk to evaluate seven colormaps. Among other findings the results show that two new double ended sequences have the highest discriminative power and good uniformity. Ways in which the technique can be applied include the design of colormaps for uniformity, and a method for evaluating colormaps through feature discrimination curves for differently sized features.},
note = {LA-UR-17-24206},
keywords = {colormaps, visualization},
pubstate = {published},
tppubtype = {inproceedings}
}
2016
Patchett, John; Nouanesengsy, Boonthanome; Fasel, Patricia; Ahrens, James
2016 CSSE L3 Milestone: Deliver In Situ to XTD End Users Technical Report
2016, (LA-UR-16-26987).
Abstract | Links | BibTeX | Tags: in-situ, visualization
@techreport{Patchett2016,

title = {2016 CSSE L3 Milestone: Deliver In Situ to XTD End Users},

author = {John Patchett and Boonthanome Nouanesengsy and Patricia Fasel and James Ahrens},

url = {http://datascience.dsscale.org/wp-content/uploads/2016/10/DeliverInSituToXTDEndUsers.pdf},

year  = {2016},

date = {2016-09-13},

abstract = {This report summarizes the activities in FY16 toward satisfying the CSSE 2016 L3 milestone to deliver in situ to XTD end users of EAP codes. The Milestone was accomplished with ongoing work to ensure the capability is maintained and developed. Two XTD end users used the in situ capability in Rage. A production ParaView capability was created in the HPC and Desktop environment. Two new capabilities were added to ParaView in support of an EAP in situ workflow.

We also worked with various support groups at the lab to deploy a production ParaView in the LANL environment for both desktop and HPC systems. . In addition, for this milestone, we moved two VTK based filters from research objects into the production ParaView code to support a variety of standard visualization pipelines for our EAP codes.},

note = {LA-UR-16-26987},

keywords = {in-situ, visualization},

pubstate = {published},

tppubtype = {techreport}

}
We also worked with various support groups at the lab to deploy a production ParaView in the LANL environment for both desktop and HPC systems. . In addition, for this milestone, we moved two VTK based filters from research objects into the production ParaView code to support a variety of standard visualization pipelines for our EAP codes.
Moreland, Kenneth; Sewell, Christopher; Usher, William; Lo, Li-ta; Meredith, Jeremy; Pugmire, David; Kress, James; Schroots, Hendrik; Ma, Kwan-Liu; Childs, Hank; Larsen, Matthew; Chen, Chun-Ming; Maynard, Robert; Geveci, Berk
VTK-m: Accelerating the Visualization Toolkit for Massively Threaded Architectures Proceedings Article
In: pp. 48-58, IEEE Computer Graphics and Applications, 2016, ISSN: 0272-1716, (LA-UR-15-27306).
Abstract | Links | BibTeX | Tags: visualization, VTK-m
@inproceedings{Moreland:2016a,

title = {VTK-m: Accelerating the Visualization Toolkit for Massively Threaded Architectures},

author = {Kenneth Moreland and Christopher Sewell and William Usher and Li-ta Lo and Jeremy Meredith and David Pugmire and James Kress and Hendrik Schroots and Kwan-Liu Ma and Hank Childs and Matthew Larsen and Chun-Ming Chen and Robert Maynard and Berk Geveci},

url = {http://ieeexplore.ieee.org/xpl/articleDetails.jsp?arnumber=7466740},

issn = {0272-1716},

year  = {2016},

date = {2016-05-01},

pages = {48-58},

publisher = {IEEE Computer Graphics and Applications},

abstract = {One of the most critical challenges for high-performance computing (HPC) scientific visualization is execution on massively threaded processors. Of the many fundamental changes we are seeing in HPC systems, one of the most profound is a reliance on new processor types optimized for execution bandwidth over latency hiding. Our current production scientific visualization software is not designed for these new types of architectures. To address this issue, the VTK-m framework serves as a container for algorithms, provides flexible data representation, and simplifies the design of visualization algorithms on new and future computer architecture.},

note = {LA-UR-15-27306},

keywords = {visualization, VTK-m},

pubstate = {published},

tppubtype = {inproceedings}

}
Ware, Colin; Rogers, David; Petersen, Mark; Ahrens, James; Aygar, Erol
Optimizing for Visual Cognition in High Performance Scientific Computing Journal Article
In: Electronic Imaging, vol. 2016, no. 16, pp. 1–9, 2016, ISSN: 2470-1173.
Abstract | Links | BibTeX | Tags: cognitive efficiency, visualization
@article{ware2016optimizing,

title = {Optimizing for Visual Cognition in High Performance Scientific Computing},

author = {Colin Ware and David Rogers and Mark Petersen and James Ahrens and Erol Aygar},

url = {http://www.ingentaconnect.com/content/ist/ei/2016/00002016/00000016/art00041},

doi = {doi:10.2352/ISSN.2470-1173.2016.16.HVEI-130},

issn = {2470-1173},

year  = {2016},

date = {2016-02-14},

journal = {Electronic Imaging},

volume = {2016},

number = {16},

pages = {1--9},

publisher = {Society for Imaging Science and Technology},

abstract = {High performance scientific computing is undergoing radical changes as we move to Exascale (1018 FLOPS) and as a consequence products for visualization must increasingly be generated in-situ as opposed to after a model run. This changes both the nature of the data products and the overall cognitive work flow. Currently, data is saved in the form of model dumps, but these are both extremely large and not ideal for visualization. Instead, we need methods for saving model data in ways that are both compact and optimized for visualization. For example, our results show that animated representations are more perceptually efficient than static views even for steady flows, so we need ways of compressing vector field data for animated visualization. Another example, motion parallax is essential to perceive structures in dark matter simulations, so we need ways of saving large particle systems optimized for perception. Turning to the cognitive work flow, when scientists and engineers allocate their time to high performance computer simulations their effort is distributed between pre and post run work. To better understand the tradeoffs we created an analytics game to model the optimization of high performance computer codes simulating ocean dynamics. Visualization is a key part of this process. The results from two analytics game experiments suggest that simple changes can have a large impact on overall cognitive efficiency. Our first experiment showed that study participants continued to look at images for much longer than optimal. A second experiment revealed a large reduction in cognitive efficiency as working memory demands increased. We conclude with recommendations for systems design.},

keywords = {cognitive efficiency, visualization},

pubstate = {published},

tppubtype = {article}

}
2015
Widanagamaachchi, Wathsala; Hammond, Karl D.; Lo, Li-Ta; Wirth, Brian D.; Samsel, Francesca; Sewell, Christopher; Ahrens, James; Pascucci, Valerio
Visualization of Large-Scale Atomistic Simulations of Plasma-Surface Interactions Proceedings Article
In: Proceedings of EuroVis (short paper), Cagliari, Italy, 2015, (LA-UR-15-21194).
Abstract | Links | BibTeX | Tags: atomistic simulation, large-scale, Model Validation and Analysis, Physical Sciences and Engineering, plasma-surface interactions, visualization
@inproceedings{Widanagamaachchi:2015a,
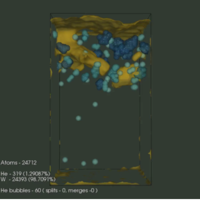
title = {Visualization of Large-Scale Atomistic Simulations of Plasma-Surface Interactions},
author = {Wathsala Widanagamaachchi and Karl D. Hammond and Li-Ta Lo and Brian D. Wirth and Francesca Samsel and Christopher Sewell and James Ahrens and Valerio Pascucci},
url = {http://datascience.dsscale.org/wp-content/uploads/2016/06/VisualizationAndAnalysisOfLarge-ScaleAtomisticSimulationsOfPlasma-SurfaceInteractions.pdf},
year = {2015},
date = {2015-05-01},
booktitle = {Proceedings of EuroVis (short paper)},
address = {Cagliari, Italy},
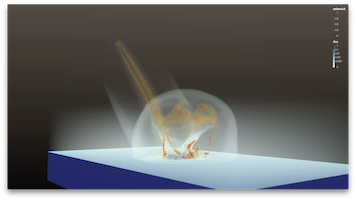
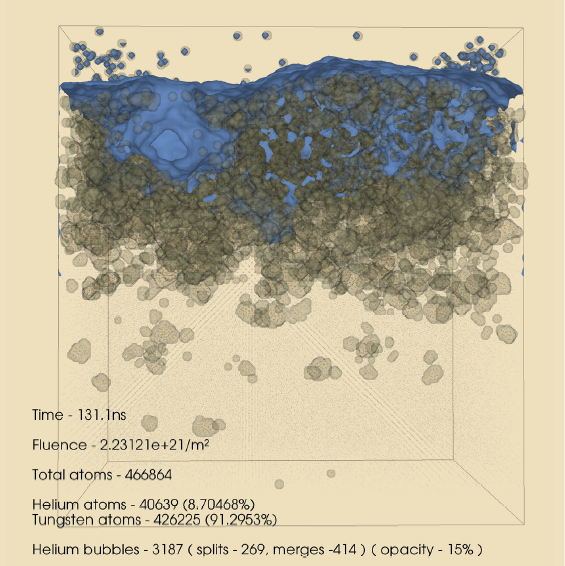
abstract = {We present a simulation–visualization pipeline that uses the LAMMPS Molecular Dynamics Simulator and the Visualization Toolkit to create a visualization and analysis environment for atomistic simulations of plasma–surface interactions. These simulations are used to understand the origin of fuzz-like, microscopic damage to tungsten and other metal surfaces by helium. The proposed pipeline serves both as an aid to visualization, i.e. drawing the surfaces of gas bubbles and voids/cavities in the metal, as well as a means of analysis, i.e. extracting various statistics and gas bubble evolution details. The result is a better understanding of the void and bubble formation process that is difficult if not impossible to get using conventional atomistic visualization software.},
note = {LA-UR-15-21194},
keywords = {atomistic simulation, large-scale, Model Validation and Analysis, Physical Sciences and Engineering, plasma-surface interactions, visualization},
pubstate = {published},
tppubtype = {inproceedings}
}
Adhinarayanan, Vignesh; Feng, Wu-chun; Woodring, Jonathan; Rogers, David; Ahrens, James
On the Greenness of In-Situ and Post-Processing Visualization Pipelines Proceedings Article
In: 11th workshop on High-Performance, Power-Aware Computing (HPPAC), Hyderabad, India, 2015, (LA-UR-15-21414).
Abstract | Links | BibTeX | Tags: greenness, in-situ, pipelines, post-processing, visualization
@inproceedings{vignesh-in-situ-hppac15,
title = {On the Greenness of In-Situ and Post-Processing Visualization Pipelines},
author = {Vignesh Adhinarayanan and Wu-chun Feng and Jonathan Woodring and David Rogers and James Ahrens},
url = {http://datascience.dsscale.org/wp-content/uploads/2016/06/OnTheGreenessOfIn-SituAndPost-ProcessingVisualizationPipelines.pdf},
year = {2015},
date = {2015-05-01},
booktitle = {11th workshop on High-Performance, Power-Aware Computing (HPPAC)},
address = {Hyderabad, India},
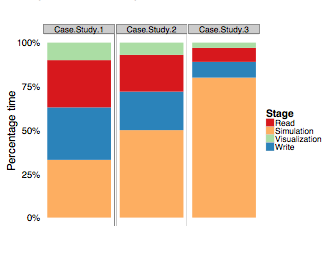
abstract = {Post-processing visualization pipelines are tradi- tionally used to gain insight from simulation data. However, changes to the system architecture for high-performance com- puting (HPC), dictated by the exascale goal, have limited the applicability of post-processing visualization. As an alternative, in-situ pipelines are proposed in order to enhance the knowl- edge discovery process via “real-time” visualization. Quantitative studies have already shown how in-situ visualization can improve performance and reduce storage needs at the cost of scientific exploration capabilities. However, to fully understand the trade- off space, a head-to-head comparison of power and energy (between the two types of visualization pipelines) is necessary. Thus, in this work, we study the greenness (i.e., power, energy, and energy efficiency) of the in-situ and the post-processing visualization pipelines, using a proxy heat-transfer simulation as an example. For a realistic I/O load, the in-situ pipeline consumes 43% less energy than the post-processing pipeline. Contrary to expectations, our findings also show that only 9% of the total energy is saved by reducing off-chip data movement, while the rest of the savings comes from reducing the system idle time. This suggests an alternative set of optimization techniques for reducing the power consumption of the traditional post- processing pipeline.},
note = {LA-UR-15-21414},
keywords = {greenness, in-situ, pipelines, post-processing, visualization},
pubstate = {published},
tppubtype = {inproceedings}
}
Samsel, Francesca; Petersen, Mark; Abram, Greg; Turton, Terece; Rogers, David; Ahrens, James
Visualization of ocean currents and eddies in a high-resolution global ocean-climate model Proceedings Article
In: Proceedings of the International Conference on High Performance Computing, Networking, Storage and Analysis 2015, 2015, (LA-UR-15-20105).
Abstract | Links | BibTeX | Tags: oceanography simulation and modeling, visualization
@inproceedings{samsel2015visualization,
title = {Visualization of ocean currents and eddies in a high-resolution global ocean-climate model},
author = {Francesca Samsel and Mark Petersen and Greg Abram and Terece Turton and David Rogers and James Ahrens},
url = {http://datascience.dsscale.org/wp-content/uploads/2017/08/VisualizationofOceanCurrentsandEddiesinaHigh-resoutionOceanModel.pdf},
year = {2015},
date = {2015-01-01},
booktitle = {Proceedings of the International Conference on High Performance Computing, Networking, Storage and Analysis 2015},
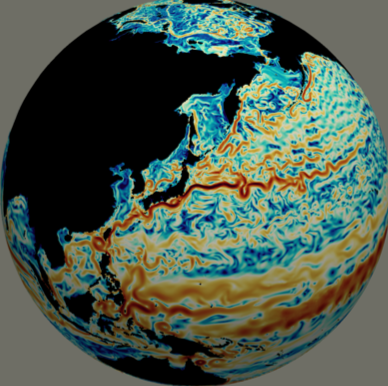
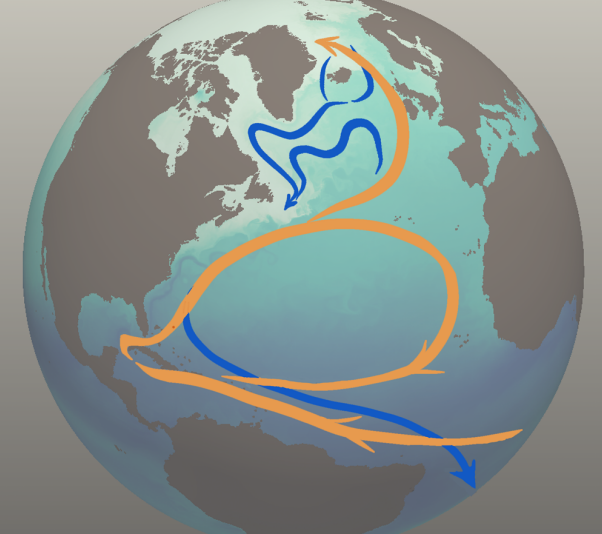
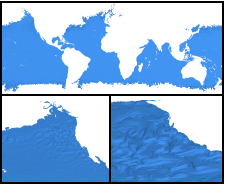
abstract = {Climate change research relies on models to better understand and predict the complex, interdependent processes that affect the atmosphere, ocean, and land. These models are computationally intensive and produce terabytes to petabytes of data. Visualization and analysis is increasingly difficult, yet is critical to gain scientific insights from large simulations. The recently-developed Model for Prediction Across Scales-Ocean (MPAS-Ocean) is designed to investigate climate change at global high-resolution (5 to 10 km grid cells) on high performance computing platforms. In the accompanying video, we use state-of-the-art visualization techniques to explore the physical processes in the ocean relevant to climate change. These include heat transport, turbulence and eddies, weakening of the meridional overturning circulation, and interaction between a warming ocean and Antarctic ice shelves. The project exemplifies the benefits of tight collaboration among scientists, artists, computer scientists, and visualization specialists.},
note = {LA-UR-15-20105},
keywords = {oceanography simulation and modeling, visualization},
pubstate = {published},
tppubtype = {inproceedings}
}
2014
Zeyen, Max
Material Science - Crystal Grain Visualization Presentation
01.10.2014, (LA-UR-pending).
Abstract | Links | BibTeX | Tags: material science, visualization
@misc{Zeyen2014,

title = {Material Science - Crystal Grain Visualization},

author = {Max Zeyen},

url = {http://datascience.dsscale.org/wp-content/uploads/2016/08/Material_Science-Crystal_Grain_Visualization.pdf},

year  = {2014},

date = {2014-10-01},

abstract = {This presentation summarizes Max Zeyen's material science project on crystal grain visualization.},

note = {LA-UR-pending},

keywords = {material science, visualization},

pubstate = {published},

tppubtype = {presentation}

}
Widanagamaachchi, Wathsala
In-situ Visualization and Analysis of Plasma Surface Interaction Simulations Presentation
01.10.2014, (LA-UR-pending).
Abstract | Links | BibTeX | Tags: in situ, plasma-surface interactions, visualization
@misc{Widanagamaachchi2014,

title = {In-situ Visualization and Analysis of Plasma Surface Interaction Simulations},

author = {Wathsala Widanagamaachchi

},

url = {http://datascience.dsscale.org/wp-content/uploads/2016/08/In-situ_Visualization_and_Analysis_Of_Plasma_Surface_Interaction_Simulations.pptx},

year  = {2014},

date = {2014-10-01},

abstract = {This presentation summarized Wathsala Widanagamaachchi's in-situ visualization and analysis summer 2014 project.},

note = {LA-UR-pending},

keywords = {in situ, plasma-surface interactions, visualization},

pubstate = {published},

tppubtype = {presentation}

}

Childs, Hank
Research challenges for visualization software Technical Report
2014.
Abstract | Links | BibTeX | Tags: visualization
@techreport{Childs2014,

title = {Research challenges for visualization software},

author = {Hank Childs},

url = {http://datascience.dsscale.org/wp-content/uploads/2016/06/ResearchChallengesForVisualizationSoftware.pdf},

year  = {2014},

date = {2014-01-01},

journal = {IEEE Computer, 46, May 2013},

abstract = {As the visualization research community reorients its software to address upcoming challenges, it must successfully deal with diverse processor architectures, distributed systems, various data sources, massive parallelism, multiple input and output devices, and interactivity.},

keywords = {visualization},

pubstate = {published},

tppubtype = {techreport}

}
Ahrens, James; Jourdain, Sebastien; O'Leary, Patrick; Patchett, John; Rogers, David; Petersen, Mark
An Image-based Approach to Extreme Scale in Situ Visualization and Analysis Proceedings Article
In: Proceedings of the International Conference for High Performance Computing, Networking, Storage and Analysis, pp. 424–434, IEEE Press, New Orleans, Louisana, 2014, ISBN: 978-1-4799-5500-8, (LA-UR-14-26864).
Abstract | Links | BibTeX | Tags: analysis, cinema, cinemascience, image-based, in-situ, visualization
@inproceedings{Ahrens:2014:IAE:2683593.2683640,

title = {An Image-based Approach to Extreme Scale in Situ Visualization and Analysis},

author = {James Ahrens and Sebastien Jourdain and Patrick O'Leary and John Patchett and David Rogers and Mark Petersen},

url = {http://datascience.dsscale.org/wp-content/uploads/2016/06/AnImage-basedApproachToExtremeScaleInSituvisualizationAndAnalysis.pdf

http://dx.doi.org/10.1109/SC.2014.40},

doi = {10.1109/SC.2014.40},

isbn = {978-1-4799-5500-8},

year  = {2014},

date = {2014-01-01},

booktitle = {Proceedings of the International Conference for High Performance Computing, Networking, Storage and Analysis},

pages = {424--434},

publisher = {IEEE Press},

address = {New Orleans, Louisana},

series = {SC '14},

abstract = {Extreme scale scientific simulations are leading a charge to exascale computation, and data analytics runs the risk of being a bottleneck to scientific discovery. Due to power and I/O constraints, we expect in situ visualization and analysis will be a critical component of these workflows. Options for extreme scale data analysis are often presented as a stark contrast: write large files to disk for interactive, exploratory analysis, or perform in situ analysis to save detailed data about phenomena that a scientists knows about in advance. We present a novel framework for a third option - a highly interactive, image-based approach that promotes exploration of simulation results, and is easily accessed through extensions to widely used open source tools. This in situ approach supports interactive exploration of a wide range of results, while still significantly reducing data movement and storage.},

note = {LA-UR-14-26864},

keywords = {analysis, cinema, cinemascience, image-based, in-situ, visualization},

pubstate = {published},

tppubtype = {inproceedings}

}
Sewell, Christopher; Ahrens, James; Patchett, John
SDAV Visualization Area: Highlights at Los Alamos with HACC Technical Report
Los Alamos National Laboratory (LANL) 2014, (LA-UR-14-22054).
Links | BibTeX | Tags: visualization
@techreport{sewell2014sdav,
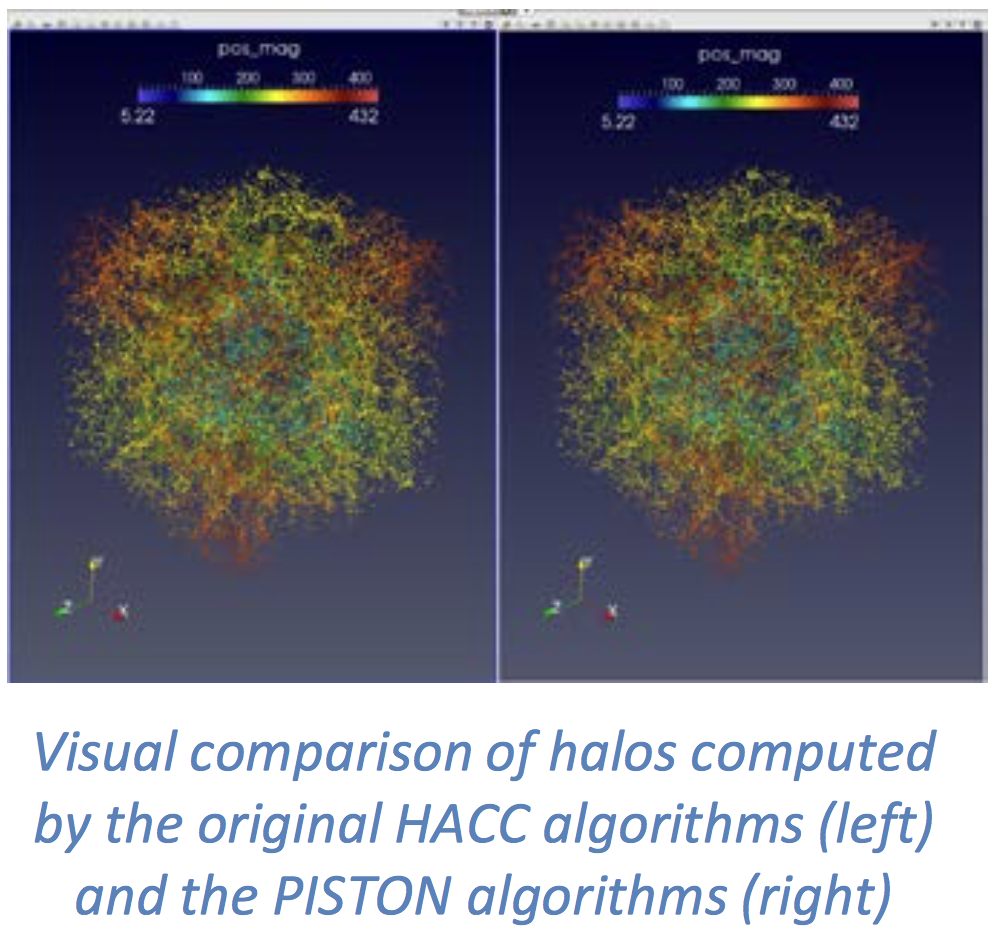
title = {SDAV Visualization Area: Highlights at Los Alamos with HACC},
author = {Christopher Sewell and James Ahrens and John Patchett},
url = {http://datascience.dsscale.org/wp-content/uploads/2017/09/LA-UR-14-22054.pdf},
year = {2014},
date = {2014-01-01},
institution = {Los Alamos National Laboratory (LANL)},
note = {LA-UR-14-22054},
keywords = {visualization},
pubstate = {published},
tppubtype = {techreport}
}
2013
Nouanesengsy, Boonthanome; Patchett, John; Ahrens, James; Bauer, Andrew; Chaudhary, Aashish; Geveci, Berk; Miller, Ross; Shipman, Galen; Williams, Dean N
Optimizing File Access Patterns through the Spatio-Temporal Pipeline for Parallel Visualization and Analysis Technical Report
2013, (LA-UR-pending).
Abstract | Links | BibTeX | Tags: Data Analysis, I/O, Modeling, Parallel Analysis, Parallel Techniques, Parallel Visualization, Spatio-Temporal Pipeline, visualization
@techreport{Nouanesengsy2013,
title = {Optimizing File Access Patterns through the Spatio-Temporal Pipeline for Parallel Visualization and Analysis},
author = {Boonthanome Nouanesengsy and John Patchett and James Ahrens and Andrew Bauer and Aashish Chaudhary and Berk Geveci and Ross Miller and Galen Shipman and Dean N Williams},
url = {http://datascience.dsscale.org/wp-content/uploads/2016/06/OptimizingFileAccessPatternsThroughTheSpatio-TemporalPipelineForParallelVisualizationAndAnalysis.pdf},
year = {2013},
date = {2013-10-13},
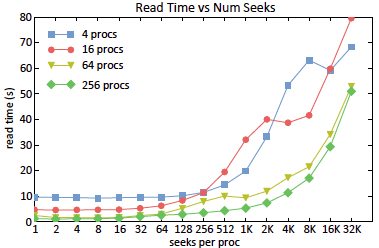
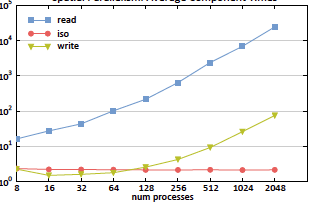
abstract = {As computational resources have become more powerful over time, availability of large-scale data has exploded, with datasets greatly increasing their spatial and temporal resolutions. For many years now, I/O read time has been recognized as the primary bottleneck for parallel visualization and analysis of large-scale data. Read times ultimately depends on how the file is stored and the file access pattern used to read the file. In this paper, we introduce a model which can estimate the read time for a file stored in a parallel filesystem when given the file access pattern. The type of parallel decomposition used directly dictates what the file access pattern will be. The spatio-temporal pipeline is used to give greater flexibility to the file access pattern used. The spatio-temporal pipeline combines both spatial and temporal parallelism to create a parallel decomposition for a task. Within the spatio-temporal pipeline, all available processes are divided into groups called time compartments. Temporal parallelism is utilized as different timesteps are independently processed by separate time compartments, and spatial parallelism is used to divide each timestep over all processes within a time compartment. The ratio between spatial and temporal parallelism is controlled by adjusting the size of a time compartment. Using the model, we were able to configure the spatio-temporal pipeline to create optimized read access patterns, resulting in a speedup factor of approximately 400 over traditional file access patterns.},
note = {LA-UR-pending},
keywords = {Data Analysis, I/O, Modeling, Parallel Analysis, Parallel Techniques, Parallel Visualization, Spatio-Temporal Pipeline, visualization},
pubstate = {published},
tppubtype = {techreport}
}
Nouanesengsy, Boonthanome; Patchett, John; Ahrens, James; Bauer, Andrew; Chaudhary, Aashish; Miller, Ross; Geveci, Berk; Shipman, Galen; Williams, Dean N
A model for optimizing file access patterns using spatio-temporal parallelism Proceedings Article
In: Proceedings of the 8th International Workshop on Ultrascale Visualization, pp. 4, ACM 2013, (LA-UR-pending).
Abstract | Links | BibTeX | Tags: Data Analysis, file access, I/O, Modeling, Modeling techniques, optimizing, parallel programming, Parallel Techniques, patio-temporal parallelism, visualization
@inproceedings{nouanesengsy2013model,

title = {A model for optimizing file access patterns using spatio-temporal parallelism},

author = {Boonthanome Nouanesengsy and John Patchett and James Ahrens and Andrew Bauer and Aashish Chaudhary and Ross Miller and Berk Geveci and Galen Shipman and Dean N Williams},

url = {http://datascience.dsscale.org/wp-content/uploads/2016/06/AModelForOptimizingFileAccessPatternsUsingSpatio-TemporalParallelism.pdf},

year  = {2013},

date = {2013-01-01},

booktitle = {Proceedings of the 8th International Workshop on Ultrascale Visualization},

pages = {4},

organization = {ACM},

abstract = {For many years now, I/O read time has been recognized as the primary bottleneck for parallel visualization and analysis of large-scale data. In this paper, we introduce a model that can estimate the read time for a file stored in a parallel filesystem when given the file access pattern. Read times ultimately depend on how the file is stored and the access pattern used to read the file. The file access pattern will be dictated by the type of parallel decomposition used. We employ spatio-temporal parallelism, which combines both spatial and temporal parallelism, to provide greater flexibility to possible file access patterns. Using our model, we were able to configure the spatio-temporal parallelism to design optimized read access patterns that resulted in a speedup factor of approximately 400 over traditional file access patterns.},

note = {LA-UR-pending},

keywords = {Data Analysis, file access, I/O, Modeling, Modeling techniques, optimizing, parallel programming, Parallel Techniques, patio-temporal parallelism, visualization},

pubstate = {published},

tppubtype = {inproceedings}

}
Sewell, Christopher; Lo, Li-ta; Ahrens, James
Portable data-parallel visualization and analysis in distributed memory environments Proceedings Article
In: Large-Scale Data Analysis and Visualization (LDAV), 2013 IEEE Symposium on, pp. 25–33, IEEE 2013, (LA-UR-13-23809).
Abstract | Links | BibTeX | Tags: analysis, Concurrent Programming, data-parallel, distributed memory, parallel programming, PISTON, visualization
@inproceedings{sewell2013portable,

title = {Portable data-parallel visualization and analysis in distributed memory environments},

author = {Christopher Sewell and Li-ta Lo and James Ahrens},

url = {http://datascience.dsscale.org/wp-content/uploads/2016/06/PortableData-ParallelVisualizationAndAnalysisInDistributedMemoryEnvironments.pdf},

year  = {2013},

date = {2013-01-01},

booktitle = {Large-Scale Data Analysis and Visualization (LDAV), 2013 IEEE Symposium on},

pages = {25--33},

organization = {IEEE},

abstract = {Data-parallelism is a programming model that maps well to architectures with a high degree of concurrency. Algorithms written using data-parallel primitives can be easily ported to any architecture for which an implementation of these primitives exists, making efficient use of the available parallelism on each. We have previously published results demonstrating our ability to compile the same data-parallel code for several visualization algorithms onto different on-node parallel architectures (GPUs and multi-core CPUs) using our extension of NVIDIAÕs Thrust library. In this paper, we discuss our extension of Thrust to support concurrency in distributed memory environments across multiple nodes. This enables the application developer to write data-parallel algorithms while viewing the data as single, long vectors, essentially without needing to explicitly take into consideration whether the values are actually distributed across nodes. Our distributed wrapper for Thrust handles the communication in the backend using MPI, while still using the standard Thrust library to take advantage of available on-node parallelism. We describe the details of our distributed implementations of several key data-parallel primitives, including scan, scatter/ gather, sort, reduce, and upper/lower bound. We also present two higher-level distributed algorithms developed using these primitives: isosurface and KD-tree construction. Finally, we provide timing results demonstrating the ability of these algorithms to take advantage of available parallelism on nodes and across multiple nodes, and discuss scaling limitations for communication-intensive algorithms such as KD-tree construction.},

note = {LA-UR-13-23809},

keywords = {analysis, Concurrent Programming, data-parallel, distributed memory, parallel programming, PISTON, visualization},

pubstate = {published},

tppubtype = {inproceedings}

}
2012
Brownlee, Carson; Patchett, John; Lo, Li-Ta; DeMarle, David; Mitchell, Christopher; Ahrens, James; Hansen, Charles
A Study of Ray Tracing Large-Scale Scientific Data in Parallel Visualization Applications Proceedings Article
In: Eurographics Symposium on Parallel Graphics and Visualization, pp. 51–60, The Eurographics Association 2012, (LA-UR-pending).
Abstract | Links | BibTeX | Tags: Distributed/network graphics, Graphics Systems, parallel, ray tracing, visualization
@inproceedings{brownlee2012study,

title = {A Study of Ray Tracing Large-Scale Scientific Data in Parallel Visualization Applications},

author = {Carson Brownlee and John Patchett and Li-Ta Lo and David DeMarle and Christopher Mitchell and James Ahrens and Charles Hansen},

url = {http://datascience.dsscale.org/wp-content/uploads/2016/06/RayTracing.pdf},

year  = {2012},

date = {2012-01-01},

booktitle = {Eurographics Symposium on Parallel Graphics and Visualization},

pages = {51--60},

organization = {The Eurographics Association},

abstract = {Large-scale analysis and visualization is becoming increasingly important as supercomputers and their simula- tions produce larger and larger data. These large data sizes are pushing the limits of traditional rendering algo- rithms and tools thus motivating a study exploring these limits and their possible resolutions through alternative rendering algorithms . In order to better understand real-world performance with large data, this paper presents a detailed timing study on a large cluster with the widely used visualization tools ParaView and VisIt. The soft- ware ray tracer Manta was integrated into these programs in order to show that improved performance could be attained with software ray tracing on a distributed memory, GPU enabled, parallel visualization resource. Using the Texas Advanced Computing Center’s Longhorn cluster which has multi-core CPUs and GPUs with large-scale polygonal data, we find multi-core CPU ray tracing to be significantly faster than both software rasterization and hardware-accelerated rasterization in existing scientific visualization tools with large data.

},

note = {LA-UR-pending},

keywords = {Distributed/network graphics, Graphics Systems, parallel, ray tracing, visualization},

pubstate = {published},

tppubtype = {inproceedings}

}
Sewell, Christopher; Meredith, Jeremy; Moreland, Kenneth; Peterka, Tom; DeMarle, David; Lo, Li-ta; Ahrens, James; Maynard, Robert; Geveci, Berk
The SDAV software frameworks for visualization and analysis on next-generation multi-core and many-core architectures Proceedings Article
In: High Performance Computing, Networking, Storage and Analysis (SCC), 2012 SC Companion:, pp. 206–214, IEEE 2012, (LA-UR-12-26928).
Abstract | Links | BibTeX | Tags: data-parallel, in-situ, many-core architectures, mult-core architectures, visualization, VTK-m
@inproceedings{sewell2012sdav,

title = {The SDAV software frameworks for visualization and analysis on next-generation multi-core and many-core architectures},

author = {Christopher Sewell and Jeremy Meredith and Kenneth Moreland and Tom Peterka and David DeMarle and Li-ta Lo and James Ahrens and Robert Maynard and Berk Geveci},

url = {http://datascience.dsscale.org/wp-content/uploads/2016/06/TheSDAVSoftwareFrameworksForVisualizationAndAnalysisOnNext-GenerationMulti-CoreAndMany-CoreArchitectures.pdf},

year  = {2012},

date = {2012-01-01},

booktitle = {High Performance Computing, Networking, Storage and Analysis (SCC), 2012 SC Companion:},

pages = {206--214},

organization = {IEEE},

abstract = {This paper surveys the four software frameworks being developed as part of the visualization pillar of the SDAV (Scalable Data Management, Analysis, and Visualization) Institute, one of the SciDAC (Scientific Discovery through Advanced Computing) Institutes established by the ASCR (Advanced Scientific Computing Research) Program of the U.S. Department of Energy. These frameworks include EAVL (Extreme-scale Analysis and Visualization Library), Dax (Data Analysis at Extreme), DIY (Do It Yourself), and PISTON. The objective of these frameworks is to facilitate the adaptation of visualization and analysis algorithms to take advantage of the available parallelism in emerging multi-core and manycore hardware architectures, in anticipation of the need for such algorithms to be run in-situ with LCF (leadership-class facilities) simulation codes on supercomputers.},

note = {LA-UR-12-26928},

keywords = {data-parallel, in-situ, many-core architectures, mult-core architectures, visualization, VTK-m},

pubstate = {published},

tppubtype = {inproceedings}

}
2011
Woodring, Jonathan; Ahrens, James; Figg, Jeannette; Wendelberger, Joanne; Habib, Salman; Heitmann, Katrin
In-situ Sampling of a Large-Scale Particle Simulation for Interactive Visualization and Analysis Proceedings Article
In: Computer Graphics Forum, pp. 1151–1160, Wiley Online Library 2011, (LA-UR-11-02106).
Abstract | Links | BibTeX | Tags: in-situ, large-scale particle simulation, sampling, visualization
@inproceedings{woodring2011situ,

title = {In-situ Sampling of a Large-Scale Particle Simulation for Interactive Visualization and Analysis},

author = {Jonathan Woodring and James Ahrens and Jeannette Figg and Joanne Wendelberger and Salman Habib and Katrin Heitmann},

url = {http://datascience.dsscale.org/wp-content/uploads/2016/06/In-situSamplingOfALarge-ScaleParticleSimulationForInteractiveVisualizationAndAnalysis.pdf},

year  = {2011},

date = {2011-01-01},

booktitle = {Computer Graphics Forum},

volume = {30},

number = {3},

pages = {1151--1160},

organization = {Wiley Online Library},

abstract = {We describe a simulation-time random sampling of a large-scale particle simu lation, the RoadRunner Universe MC 3 cosmological simulation, for interactive post-analysis and visualization. Simu lation data generation rates will continue to be far greater than storage bandwidth rates by many orders of magnitude. This implies that only a very small fraction of data generated by a simulation can ever be stored a nd subsequently post-analyzed. The limiting factors in this situation are similar to the problem in many population surveys : there aren’t enough human resources to query a large population. To cope with the lack of resource s, statistical sampling techniques are used to create a representative data set of a large population. Following this analo gy, we propose to store a simulation-time random sampling of the particle data for post-analysis, with level-of-detail organization, to cope with the bottlenecks. A sample is stored directly from the simulation in a level-of-detail for mat for post-visualization and analysis, which amortizes the cost of post-processing and reduces wo rkflow time. Additionally by sampling during the simulation, we are able to analyze the entire particle population to record full population statistics and quantify sample error.},

note = {LA-UR-11-02106},

keywords = {in-situ, large-scale particle simulation, sampling, visualization},

pubstate = {published},

tppubtype = {inproceedings}

}
Mitchell, Christopher; Ahrens, James; Wang, Jun
Visio: Enabling interactive visualization of ultra-scale, time series data via high-bandwidth distributed i/o systems Proceedings Article
In: Parallel & Distributed Processing Symposium (IPDPS), 2011 IEEE International, pp. 68–79, IEEE 2011, (LA-UR-10-07014).
Abstract | Links | BibTeX | Tags: distributed i/o, Parallel Computing, scientific visualization, ultra-scale, visualization
@inproceedings{mitchell2011visio,

title = {Visio: Enabling interactive visualization of ultra-scale, time series data via high-bandwidth distributed i/o systems},

author = {Christopher Mitchell and James Ahrens and Jun Wang},

url = {http://datascience.dsscale.org/wp-content/uploads/2016/06/VisIO-IPDPS11.pdf},

year  = {2011},

date = {2011-01-01},

booktitle = {Parallel & Distributed Processing Symposium (IPDPS), 2011 IEEE International},

pages = {68--79},

organization = {IEEE},

abstract = {Petascale simulations compute at resolutions ranging into billions of cells and write terabytes of data for visualization and analysis. Interactive visualization of this time series is a desired step before starting a new run. The I/O subsystem and associated network often are a significant impediment to interactive visualization of time-varying data; as they are not configured or provisioned to provide necessary I/O read rates. In this paper, we propose a new I/O library for visualization applications: VisIO. Visualization applications commonly use N- to-N reads within their parallel enabled readers which provides an incentive for a shared-nothing approach to I/O, similar to other data-intensive approaches such as Hadoop. However, unlike other data-intensive applications, visualization requires: (1) interactive performance for large data volumes, (2) compatibility with MPI and POSIX file system semantics for compatibility with existing infrastructure, and (3) use of existing file formats and their stipulated data partitioning rules. VisIO, provides a mechanism for using a non-POSIX distributed file system to provide linear scaling of I/O bandwidth. In addition, we introduce a novel scheduling algorithm that helps to co-locate visualization processes on nodes with the requested data. Testing using VisIO integrated into ParaView was conducted using the Hadoop Distributed File System (HDFS) on TACC’s Longhorn cluster. A representative dataset, VPIC, across 128 nodes showed a 64.4% read performance improvement compared to the provided Lustre installation. Also tested, was a dataset representing a global ocean salinity simulation that showed a 51.4% improvement in read performance over Lustre when using our VisIO system. VisIO, provides powerful high-performance I/O services to visualization applications, allowing for interactive performance with ultra-scale, time-series data.},

note = {LA-UR-10-07014},

keywords = {distributed i/o, Parallel Computing, scientific visualization, ultra-scale, visualization},

pubstate = {published},

tppubtype = {inproceedings}

}
2010
Ahrens, James; Heitmann, Katrin; Petersen, Mark; Woodring, Jonathan; Williams, Sean; Fasel, Patricia; Ahrens, Christine; Hsu, Chung-Hsing; Geveci, Berk
Verifying Scientific Simulations via Comparative and Quantitative Visualization Journal Article
In: IEEE Computer Graphics and Applications, vol. 30, no. 6, pp. 16-28, 2010, ISSN: 0272-1716.
Abstract | Links | BibTeX | Tags: meteorology, visualization
@article{LAPR-2010-010807,

title = {Verifying Scientific Simulations via Comparative and Quantitative Visualization},

author = {James Ahrens and Katrin Heitmann and Mark Petersen and Jonathan Woodring and Sean Williams and Patricia Fasel and Christine Ahrens and Chung-Hsing Hsu and Berk Geveci},

url = {http://ieeexplore.ieee.org/document/5560617/},

doi = {10.1109/MCG.2010.100},

issn = {0272-1716},

year  = {2010},

date = {2010-01-01},

journal = {IEEE Computer Graphics and Applications},

volume = {30},

number = {6},

pages = {16-28},

abstract = {This article presents a visualization-assisted process that veri es scienti c- simulation codes. Code veri cation is necessary because scientists require accurate predictions to interpret data con dently. This veri cation process integrates iterative hypothesis veri cation with comparative, feature, and quantitative visualization. Following this process can help identify differences in cosmological and oceanographic simulations.},

keywords = {meteorology, visualization},

pubstate = {published},

tppubtype = {article}

}
2008
Ahrens, James; Lo, Li-Ta; Nouanesengsy, Boonthanome; Patchett, John; McPherson, Allen
Petascale visualization: Approaches and initial results Proceedings Article
In: Ultrascale Visualization, 2008. UltraVis 2008. Workshop on, pp. 24–28, IEEE 2008, (LA-UR-10-02237).
Abstract | Links | BibTeX | Tags: petascale, visualization
@inproceedings{ahrens2008petascale,
title = {Petascale visualization: Approaches and initial results},
author = {James Ahrens and Li-Ta Lo and Boonthanome Nouanesengsy and John Patchett and Allen McPherson},
url = {http://datascience.dsscale.org/wp-content/uploads/2016/06/PetascaleVisualizationApproachesAndInitialResults.pdf},
year = {2008},
date = {2008-01-01},
booktitle = {Ultrascale Visualization, 2008. UltraVis 2008. Workshop on},
pages = {24--28},
organization = {IEEE},
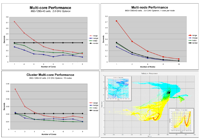
abstract = {With the advent of the first petascale supercomputer, Los Alamos’s Roadrunner, there is a pressing need to address how to visualize petascale data. The crux of the petascale visualization performance problem is interactive rendering, since it is the most computationally intensive portion of the visualization process. For terascale platforms, commodity clusters with graphics processors (GPUs) have been used for interactive rendering. For petascale platforms, visualization and rendering may be able to run efficiently on the supercomputer platform itself. In this work, we evaluated the rendering performance of multi-core CPU and GPU-based processors. To achieve high-performance on multi-core processors, we tested with multi-core optimized raytracing engines for rendering. For real-world performance testing, and to prepare for petascale visualization tasks, we interfaced these rendering engines with VTK and ParaView. Initial results show that rendering software optimized for multi-core CPU processors provides competitive performance to GPUs for the parallel rendering of massive data. The current architectural multi-core trend suggests multi-core based supercomputers are able to provide interactive visualization and rendering support now and in the future.},
note = {LA-UR-10-02237},
keywords = {petascale, visualization},
pubstate = {published},
tppubtype = {inproceedings}
}
McCormick, Patrick; Anderson, Erik; Martin, Steven; Brownlee, Carson; Inman, Jeff; Maltrud, Mathew; Kim, Mark; Ahrens, James; Nau, Lee
Quantitatively driven visualization and analysis on emerging architectures Proceedings Article
In: Journal of Physics: Conference Series, pp. 012095, IOP Publishing 2008, (LA-UR-10-02239).
Abstract | Links | BibTeX | Tags: emerging architectures, quantitatively driven visualization, visualization
@inproceedings{mccormick2008quantitatively,

title = {Quantitatively driven visualization and analysis on emerging architectures},

author = {Patrick McCormick and Erik Anderson and Steven Martin and Carson Brownlee and Jeff Inman and Mathew Maltrud and Mark Kim and James Ahrens and Lee Nau},

url = {http://datascience.dsscale.org/wp-content/uploads/2016/06/QuantitativelyDrivenVisualizationAndAnalysisOnEmergingArchitectures.pdf},

year  = {2008},

date = {2008-01-01},

booktitle = {Journal of Physics: Conference Series},

volume = {125},

number = {1},

pages = {012095},

organization = {IOP Publishing},

abstract = {We live in a world of ever-increasing amounts of information that is not only dynamically changing but also dramatically changing in complexity. This trend of “information overload” has quickly overwhelmed our capabilities to explore, hypothesize, and thus fully interpret the underlying details in these data. To further complicate matters, the computer architectures that have traditionally provided improved performance are undergoing a revolutionary change as manufacturers transition to building multi- and many-core processors. While these trends have the potential to lead to new scientific breakthroughs via simulation and modeling, they will do so in a disruptive manner, potentially placing a significant strain on software development activities including the overall data analysis process. In this paper we explore an approach that exploits these emerging architectures to provide an integrated environment for high-performance data analysis and visualization.},

note = {LA-UR-10-02239},

keywords = {emerging architectures, quantitatively driven visualization, visualization},

pubstate = {published},

tppubtype = {inproceedings}

}
2007
Ahrens, James; Desai, Nehal; McCormick, Patrick; Martin, Ken; Woodring, Jonathan
A modular extensible visualization system architecture for culled prioritized data streaming Proceedings Article
In: Electronic Imaging 2007, pp. 64950I–64950I, International Society for Optics and Photonics 2007, (LA-UR-07-5141).
Abstract | Links | BibTeX | Tags: data streaming, visualization
@inproceedings{ahrens2007modular,

title = {A modular extensible visualization system architecture for culled prioritized data streaming},

author = {James Ahrens and Nehal Desai and Patrick McCormick and Ken Martin and Jonathan Woodring},

url = {http://datascience.dsscale.org/wp-content/uploads/2016/06/AModularExtensibleVisualizationSystemArchitectureForCulledPrioritizedDataStreaming.pdf},

year  = {2007},

date = {2007-01-01},

booktitle = {Electronic Imaging 2007},

pages = {64950I--64950I},

organization = {International Society for Optics and Photonics},

abstract = {Massive dataset sizes can make visualization difficult or impossible. One solution to this problem is to divide a dataset into smaller pieces and then stream these pieces through memory, running algorithms on each piece. This paper presents a modular data-flow visualization system architecture for culling and prioritized data streaming. This streaming architecture improves program performance both by discarding pieces of the input dataset that are not required to complete the visualization, and by prioritizing the ones that are. The system supports a wide variety of culling and prioritization techniques, including those based on data value, spatial constraints, and occlusion tests. Prioritization ensures that pieces are processed and displayed progressively based on an estimate of their contribution to the resulting image. Using prioritized ordering, the architecture presents a progressively rendered result in a significantly shorter time than a standard visualization architecture. The design is modular, such that each module in a user-defined data-flow visualization program can cull pieces as well as contribute to the final processing order of pieces. In addition, the design is extensible, providing an interface for the addition of user-defined culling and prioritization techniques to new or existing visualization modules.},

note = {LA-UR-07-5141},

keywords = {data streaming, visualization},

pubstate = {published},

tppubtype = {inproceedings}

}
Woodring, Jonathan; Shen, Han-Wei
Incorporating highlighting animations into static visualizations Proceedings Article
In: Electronic Imaging 2007, pp. 649503–649503, International Society for Optics and Photonics 2007.
Abstract | Links | BibTeX | Tags: animation, highlighting, visualization
@inproceedings{woodring2007incorporating,
title = {Incorporating highlighting animations into static visualizations},
author = {Jonathan Woodring and Han-Wei Shen},
url = {http://datascience.dsscale.org/wp-content/uploads/2016/06/IncorporatingHighlightingAnimationsIntoStaticVisualizations.pdf},
year = {2007},
date = {2007-01-01},
booktitle = {Electronic Imaging 2007},
pages = {649503--649503},
organization = {International Society for Optics and Photonics},
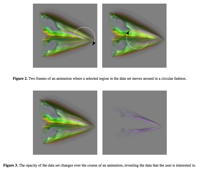
abstract = {Rendering a lot of data results in cluttered visualizations. It is difficult for a user to find regions of interest from contextual data especially when occlusion is considered. We incorporate animations into visualization by adding positional motion and opacity change as a highlighting mechanism. By leveraging our knowledge on motion perception, we can help a user to visually filter out her selected data by rendering it with animation. Our framework of adding animation is the animation transfer function, where it provides a mapping from data and animation frame index to a changing visual property. The animation transfer function describes animations for user selected regions of interest. In addition to our framework, we explain the implementation of animations as a modification of the rendering pipeline. The animation rendering pipeline allows us to easily incorporate animations into existing software and hardware based volume renderers.},
keywords = {animation, highlighting, visualization},
pubstate = {published},
tppubtype = {inproceedings}
}
2005
Ahrens, James; Geveci, Berk; Law, Charles
ParaView: An End-User Tool for Large-Data Visualization Journal Article
In: The Visualization Handbook, pp. 717, 2005, (LA-UR-03-1560).
Abstract | Links | BibTeX | Tags: ParaView, visualization
@article{ahrens200536,
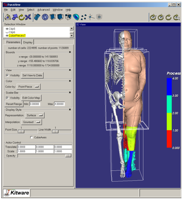
title = {ParaView: An End-User Tool for Large-Data Visualization},
author = {James Ahrens and Berk Geveci and Charles Law},
url = {http://datascience.dsscale.org/wp-content/uploads/2016/06/ParaView.pdf},
year = {2005},
date = {2005-01-01},
journal = {The Visualization Handbook},
pages = {717},
publisher = {Citeseer},
abstract = {This paper describes the design and features of a visualization tool, called ParaViewi, a tool for scientists to visualize and analysis extremely large data sets. The tool provides a graphical user interface for the creation and dynamic execution of visualization tasks. ParaView transparently supports the visualization and rendering of large data sets by executing these programs in parallel on shared or distributed memory machines. ParaView supports hardware-accelerated parallel rendering and achieves interactive rendering performance via level-of-detail techniques. The design balances and integrates a number of diverse requirements including the ability to handle large data, ease of use and extensibility by developers. This paper describes the requirements that guided the design, identifies their importance to scientific users, and discusses key design decision and tradeoffs.},
note = {LA-UR-03-1560},
keywords = {ParaView, visualization},
pubstate = {published},
tppubtype = {article}
}
2003
Stompel, Aleksander; Ma, Kwan-Liu; Lum, Eric B; Ahrens, James; Patchett, John
SLIC: scheduled linear image compositing for parallel volume rendering Proceedings Article
In: Proceedings of the 2003 IEEE Symposium on Parallel and Large-Data Visualization and Graphics, pp. 6, IEEE Computer Society 2003, (LA-UR-03-5482).
Abstract | Links | BibTeX | Tags: high-performance computing, image com- positing, parallel rendering, PC clusters, visualization, vol- ume rendering
@inproceedings{stompel2003slic,

title = {SLIC: scheduled linear image compositing for parallel volume rendering},

author = {Aleksander Stompel and Kwan-Liu Ma and Eric B Lum and James Ahrens and John Patchett},

url = {http://datascience.dsscale.org/wp-content/uploads/2016/06/SLICScheduledLinearImageCmpositingForParallelVolumeRendering.pdf},

year  = {2003},

date = {2003-01-01},

booktitle = {Proceedings of the 2003 IEEE Symposium on Parallel and Large-Data Visualization and Graphics},

pages = {6},

organization = {IEEE Computer Society},

abstract = {Parallel volume rendering offers a feasible solution to the large data visualization problem by distributing both the data and rendering calculations among multiple computers connected by a network. In sort-last parallel volume rendering, each processor generates an image of its assigned subvolume, which is blended together with other images to derive the final image. Improving the efficiency of this compositing step, which requires interprocesssor communication, is the key to scalable, interactive rendering. The recent trend of using hardware-accelerated volume rendering demands further acceleration of the image compositing step. This paper presents a new optimized parallel image compositing algorithm and its performance on a PC cluster. Our test results show that this new algorithm offers significant savings over previous algorithms in both communication and compositing costs. On a 64-node PC cluster with a 100BaseT network interconnect, we can achieve interactive rendering rates for images at resolutions up to 1024 × 1024 pixels at several frames per second.},

note = {LA-UR-03-5482},

keywords = {high-performance computing, image com- positing, parallel rendering, PC clusters, visualization, vol- ume rendering},

pubstate = {published},

tppubtype = {inproceedings}

}
2001
Law, Charles; Henderson, Amy; Ahrens, James
An application architecture for large data visualization: a case study Proceedings Article
In: Proceedings of the IEEE 2001 symposium on parallel and large-data visualization and graphics, pp. 125–128, IEEE Press 2001, (LA-UR-01-5530).
Abstract | Links | BibTeX | Tags: application architecture, visualization
@inproceedings{law2001application,

title = {An application architecture for large data visualization: a case study},

author = {Charles Law and Amy Henderson and James Ahrens},

url = {http://datascience.dsscale.org/wp-content/uploads/2016/06/AnApplicationFarhitectureForLargeDataVisualizationACaseStudy.pdf},

year  = {2001},

date = {2001-01-01},

booktitle = {Proceedings of the IEEE 2001 symposium on parallel and large-data visualization and graphics},

pages = {125--128},

organization = {IEEE Press},

abstract = {In this case study we present an open-source visualization application with a duta-parallel novel application architecture. The architecture is unique because is uses the Tcl scripting language to synchronize the user integuce with the VTK parallel visualization pipeline and parallel-rendering module. The resulting application shows scalable performance, and is easily extendable because of its simple modulur architecture. We demonstrate the application with a 9.8 gigabyte structured-grid ocean model.},

note = {LA-UR-01-5530},

keywords = {application architecture, visualization},

pubstate = {published},

tppubtype = {inproceedings}

}
2000
Ahrens, James; Law, Charles; Schroeder, Will; Martin, Ken; Papka, Michael
A Parallel Approach for Efficiently Visualizing Extremely Large, Time-Varying Datasets. Technical Report
2000, (LA-UR-00-1620).
Abstract | Links | BibTeX | Tags: large datasets, visualization
@techreport{info:lanl-repo/lareport/LA-UR-00-1620,

title = {A Parallel Approach for Efficiently Visualizing Extremely Large, Time-Varying Datasets.},

author = {James Ahrens and Charles Law and Will Schroeder and Ken Martin and Michael Papka},

url = {http://datascience.dsscale.org/wp-content/uploads/2017/09/LA-UR-00-1620.pdf},

year  = {2000},

date = {2000-01-01},

abstract = {A significant unsolved problem in scientific visualization is how to efficiently visualize extremely large time-varying datasets. Using parallelism provides a promising solution. One drawback of this approach is the high overhead and specialized knowledge often required to create parallel visualization programs. In this paper, we present a parallel visualization system that is scalable, portable and encapsulates parallel programming details for its users. Our approach was to augment an existing visualization system, the visualization toolkit(VTK). Process and communication abstractions were added in order to support task, pipeline and data parallelism. The resulting system allows users to quickly write parallel visualization programs and avoid rewriting these programs when porting to new platforms. The performance of a collection of parallel visualization programs written using this system and run on both a cluster of SGI Origin 2000s and a Linux-based PC cluster is presented. In addition to showing the utility of our approach, the results offer a comparison of the performance of commodity-based computing clusters.},

howpublished = {IEEE/VISUALIZATION CONF. ; 200010 ; SALT LAKE CITY},

note = {LA-UR-00-1620},

keywords = {large datasets, visualization},

pubstate = {published},

tppubtype = {techreport}

}
Bujack, Roxana
Discussion and Visualization of Distinguished Hyperbolic Trajectories as a Generalization of Critical Points to 2D Time-dependent Flow Proceedings Article
In: 2022 Topological Data Analysis and Visualization (TopoInVis), pp. 59-69, 2022.
@inproceedings{9975815,

title = {Discussion and Visualization of Distinguished Hyperbolic Trajectories as a Generalization of Critical Points to 2D Time-dependent Flow},

author = {Roxana Bujack},

url = {http://www.informatik.uni-leipzig.de/~bujack/2022topoInVis.pdf},

doi = {10.1109/TopoInVis57755.2022.00013},

year  = {2022},

date = {2022-01-01},

urldate = {2022-01-01},

booktitle = {2022 Topological Data Analysis and Visualization (TopoInVis)},

pages = {59-69},

abstract = {Classical vector field topology has proven to be a useful visualization technique for steady flow, but its straightforward application to time-dependent flows lacks physical meaning. Necessary requirements for physical meaningfulness include the results to be objective, i.e., independent of the frame of reference of the observer, and Lagrangian, i.e., that the generalized critical points are trajectories. We analyze whether the theoretical concept of distinguished hyperbolic trajectories provides a physically meaningful generalization to classical critical points and if the existing extraction algorithms correctly compute what has been defined mathematically. We show that both theory and algorithms constitute a significant improvement over previous methods.We further present a method to visualize a time-dependent flow field in the reference frames of distinguished trajectories. The result is easy to interpret because it makes these trajectories look like classical critical points for each instance in time, but it is meaningful because it is Lagrangian and objective.},

keywords = {},

pubstate = {published},

tppubtype = {inproceedings}

}
Abram, Greg; Navrátil, Paul; Grossett, Pascal; Rogers, David; Ahrens, James
Galaxy: Asynchronous Ray Tracing for Large High-Fidelity Visualization Proceedings Article
In: 2018 IEEE 8th Symposium on Large Data Analysis and Visualization (LDAV), pp. 72-76, 2018, ISSN: null, (LA-UR-18-26088).
@inproceedings{8739241,

title = {Galaxy: Asynchronous Ray Tracing for Large High-Fidelity Visualization},

author = {Greg Abram and Paul Navrátil and Pascal Grossett and David Rogers and James Ahrens},

doi = {10.1109/LDAV.2018.8739241},

issn = {null},

year  = {2018},

date = {2018-10-01},

booktitle = {2018 IEEE 8th Symposium on Large Data Analysis and Visualization (LDAV)},

pages = {72-76},

abstract = {We present Galaxy, a fully asynchronous distributed parallel rendering engine geared towards using full global illumination for large-scale visualization. Galaxy provides performant distributed rendering of complex lighting and material models, particularly those that require ray traversal across nodes. Our design is favorable for tightly-coupled in situ scenarios, where data remains on simulation nodes. By employing asynchronous framebuffer updates and a novel subtractive lighting model, we achieve acceptable image quality from the first ray generation, and improve quality throughout the render epoch. On simulated in situ rendering tasks, Galaxy outperforms the current best-of-breed scientific ray tracer by over 3× for distributed geometric and particle data, while providing expanded rendering capability for global illumination and complex materials.},

note = {LA-UR-18-26088},

keywords = {},

pubstate = {published},

tppubtype = {inproceedings}

}
Vogel, Sven; Biwer, Chris; Rogers, David; Ahrens, James; Hackenberg, Robert; Onken, Drew; Zhang, Jianzhong
Interactive visualization of multi-data-set Rietveld analyses using Cinema:Debye-Scherrer Journal Article
In: Journal of Applied Crystallography, vol. 51, no. 3, pp. 943–951, 2018.
@article{Vogel:ks5597,

title = {Interactive visualization of multi-data-set Rietveld analyses using \textit{Cinema:Debye-Scherrer}},

author = {Sven Vogel and Chris Biwer and David Rogers and James Ahrens and Robert Hackenberg and Drew Onken and Jianzhong Zhang},

url = {https://doi.org/10.1107/S1600576718003989},

doi = {10.1107/S1600576718003989},

year  = {2018},

date = {2018-06-01},

journal = {Journal of Applied Crystallography},

volume = {51},

number = {3},

pages = {943--951},

abstract = {A tool named \textit{Cinema:Debye-Scherrer} to visualize the results of a series of Rietveld analyses is presented. The multi-axis visualization of the high-dimensional data sets resulting from powder diffraction analyses allows identification of analysis problems, prediction of suitable starting values, identification of gaps in the experimental parameter space and acceleration of scientific insight from the experimental data. The tool is demonstrated with analysis results from 59 U—Nb alloy samples with different compositions, annealing times and annealing temperatures as well as with a high-temperature study of the crystal structure of CsPbBr_{3}. A script to extract parameters from a series of Rietveld analyses employing the widely used \textit{GSAS} Rietveld software is also described. Both software tools are available for download.},

keywords = {},

pubstate = {published},

tppubtype = {article}

}
Zeyen, Max; Post, Tobias; Hagen, Hans; Ahrens, James; Rogers, David; Bujack, Roxana
Color Interpolation for Non-Euclidean Color Spaces Proceedings Article
In: IEEE Scientific Visualization Conference (SciVis) Short Papers, IEEE, 2018.
@inproceedings{zeyen2018interpolation,

title = {Color Interpolation for Non-Euclidean Color Spaces},

author = {Max Zeyen and Tobias Post and Hans Hagen and James Ahrens and David Rogers and Roxana Bujack},

url = {https://datascience.dsscale.org/wp-content/uploads/2019/01/ColorInterpolationforNon-EuclideanColorSpaces.pdf},

year  = {2018},

date = {2018-01-01},

booktitle = {IEEE Scientific Visualization Conference (SciVis) Short Papers},

publisher = {IEEE},

abstract = {Color interpolation is critical to many applications across a variety of domains, like color mapping or image processing. Due to the characteristics of the human visual system, color spaces whose distance measure is designed to mimic perceptual color differences tend to be non-Euclidean. In this setting, a generalization of established interpolation schemes is not trivial. This paper presents an approach to generalize linear interpolation to colors for color spaces equipped with an arbitrary non-Euclidean distance measure. It makes use of the fact that in Euclidean spaces, a straight line coincides with the shortest path between two points. Additionally, we provide an interactive implementation of our method for the CIELAB color space using the CIEDE2000 distance measure integrated into VTK and ParaView.},

keywords = {},

pubstate = {published},

tppubtype = {inproceedings}

}
Bujack, Roxana; Turton, Terece; Rogers, David; Ahrens, James
Ordering Perceptions about Perceptual Order Proceedings Article
In: IEEE Scientific Visualization Conference (SciVis) Short Papers, IEEE, 2018.
@inproceedings{bujack2018ordering,

title = {Ordering Perceptions about Perceptual Order},

author = {Roxana Bujack and Terece Turton and David Rogers and James Ahrens},

url = {https://datascience.dsscale.org/wp-content/uploads/2019/01/OrderingPerceptionsaboutPerceptualOrder.pdf},

year  = {2018},

date = {2018-01-01},

booktitle = {IEEE Scientific Visualization Conference (SciVis) Short Papers},

publisher = {IEEE},

abstract = {One of the most important properties that inherently defines a good colormap is perceptual order. In the literature, we find a wide range of recommendations and hypotheses regarding order. Properties such as monotonicity in luminance, saturation, or hue are/are not stated as necessary/sufficient to ensure perceptual order. In this paper, we gather the most common statements about perceptual order and, when possible, prove or disprove them.},

keywords = {},

pubstate = {published},

tppubtype = {inproceedings}

}
Yang, Bo; Kostkova, Jitka; Flusser, Jan; Suk, Tomas; Bujack, Roxana
Rotation Invariants of Vector Fields from Orthogonal Moments Journal Article
In: Pattern Recognition, no. Supplement C, pp. 110 - 121, 2017, ISSN: 0031-3203, (LA-UR-17-26797, Under a Creative Comms license: http://creativecommons.org/licenses/by-nc-nd/4.0/).
@article{yang2017rotation,

title = {Rotation Invariants of Vector Fields from Orthogonal Moments},

author = {Bo Yang and Jitka Kostkova and Jan Flusser and Tomas Suk and Roxana Bujack},

url = {http://datascience.dsscale.org/wp-content/uploads/2017/09/LA-UR-17-26797.pdf},

doi = {10.1016/j.patcog.2017.09.004},

issn = {0031-3203},

year  = {2017},

date = {2017-09-11},

booktitle = {Pattern Recognition},

journal = {Pattern Recognition},

number = {Supplement C},

pages = {110 - 121},

abstract = {Abstract Vector field images are a type of new multidimensional data that appear in many engineering areas. Although the vector fields can be visualized as images, they differ from graylevel and color images in several aspects. To analyze them, special methods and algorithms must be originally developed or substantially adapted from the traditional image processing area. In this paper, we propose a method for the description and matching of vector field patterns under an unknown rotation of the field. Rotation of a vector field is so-called total rotation, where the action is applied not only on the spatial coordinates but also on the field values. Invariants of vector fields with respect to total rotation constructed from orthogonal Gaussian--Hermite moments and Zernike moments are introduced. Their numerical stability is shown to be better than that of the invariants published so far. We demonstrate their usefulness in a real world template matching application of rotated vector fields.},

note = {LA-UR-17-26797, Under a Creative Comms license: http://creativecommons.org/licenses/by-nc-nd/4.0/},

keywords = {},

pubstate = {published},

tppubtype = {article}

}
Berres, Anne; Adhinarayanan, Vignesh; Turton, Terece; Feng, Wu; Rogers, David
A Pipeline for Large Data Processing Using Regular Sampling for Unstructured Grids Proceedings Article
In: 2017, (LA-UR-17-23903).
@inproceedings{info:lanl-repo/lareport/LA-UR-17-23903,

title = {A Pipeline for Large Data Processing Using Regular Sampling for Unstructured Grids},

author = {Anne Berres and Vignesh Adhinarayanan and Terece Turton and Wu Feng and David Rogers},

url = {http://datascience.dsscale.org/wp-content/uploads/2017/08/LA-UR-17-23903.pdf},

year  = {2017},

date = {2017-05-12},

abstract = {Large simulation data requires a lot of time and computational resources to compute, store, analyze, visualize, and run user studies. Today, the largest cost of a supercomputer is not hardware but maintenance, in particular energy consumption. Our goal is to balance energy consumption and cognitive value of visualizations of resulting data. This requires us to go through the entire processing pipeline, from simulation to user studies. To reduce the amount of resources, data can be sampled or compressed. While this adds more computation time, the computational overhead is negligible compared to the simulation time. We built a processing pipeline at the example of regular sampling. The reasons for this choice are two-fold: using a simple example reduces unnecessary complexity as we know what to expect from the results. Furthermore, it provides a good baseline for future, more elaborate sampling methods. We measured time and energy for each test we did, and we conducted user studies in Amazon Mechanical Turk (AMT) for a range of different results we produced through sampling.

},

note = {LA-UR-17-23903},

keywords = {},

pubstate = {published},

tppubtype = {inproceedings}

}
Banesh, Divya; Schoonover, Joseph; Ahrens, James; Hamann, Bernd
Extracting, Visualizing and Tracking Mesoscale Ocean Eddies in Two-dimensional Image Sequences Using Contours and Moments Proceedings Article
In: 2017, (Workshop on Visualisation in Environmental Sciences (EnvirVis), LA-UR-17-21623).
@inproceedings{Authors2017,

title = {Extracting, Visualizing and Tracking Mesoscale Ocean Eddies in Two-dimensional Image Sequences Using Contours and Moments},

author = {Divya Banesh and Joseph Schoonover and James Ahrens and Bernd Hamann},

url = {http://datascience.dsscale.org/wp-content/uploads/2017/08/ExtractingVisualizingandTrackingMesoscaleOceanEddiesinTwo-dimensionalImageSequencesUsingContoursandMoments.pdf},

year  = {2017},

date = {2017-03-31},

abstract = {We introduce a system for the extraction and tracking of mesoscale eddies captured in massive global ocean simulations. The major strength and contribution of our system is its design, which is based on two-dimensional image data processing. The Cinema database [CD] makes possible the generation and storage of two-dimensional image data taken in-situ, i.e., the creation of images via a virtual camera generating images during the ongoing simulation. The problem of eddy extraction and tracking is simplified by our approach to the problem of finding, matching and tracking eddies in two-dimensional images, thus eliminating the task of processing the original massive three-dimensional data set. Our system can be used on a simple desktop computer and provides an intuitive interface allowing a scientist to perform an eddy analysis for global ocean data in real-time. We demonstrate the effectiveness of our implementation for a specific simulated data set.},

note = {Workshop on Visualisation in Environmental Sciences (EnvirVis), LA-UR-17-21623},

keywords = {},

pubstate = {published},

tppubtype = {inproceedings}

}
Hamilton, Stephen; Burns, Randal; Meneveau, Charles; Johnson, Perry; Lindstrom, Peter; Patchett, John; Szalay, Alexander S.
Extreme Event Analysis in Next Generation Simulation Architectures Proceedings Article
In: Kunkel, Julian M.; Yokota, Rio; Balaji, Pavan; Keyes, David (Ed.): High Performance Computing: 32nd International Conference, ISC High Performance 2017, Frankfurt, Germany, June 18--22, 2017, Proceedings, pp. 277–293, Springer, Cham Springer International Publishing}, 2017, ISBN: 978-3-319-58667-0.
@inproceedings{hamilton2017extreme,

title = {Extreme Event Analysis in Next Generation Simulation Architectures},

author = {Stephen Hamilton and Randal Burns and Charles Meneveau and Perry Johnson and Peter Lindstrom and John Patchett and Alexander S. Szalay},

editor = {Julian M. Kunkel and Rio Yokota and Pavan Balaji and David Keyes},

url = {http://datascience.dsscale.org/wp-content/uploads/2017/08/ExtremeEventAnalysisinNextGenerationSimulationArchitectures.pdf},

doi = {10.1007/978-3-319-58667-0_15},

isbn = {978-3-319-58667-0},

year  = {2017},

date = {2017-01-01},

booktitle = {High Performance Computing: 32nd International Conference, ISC High Performance 2017, Frankfurt, Germany, June 18--22, 2017, Proceedings},

pages = {277--293},

publisher = {Springer International Publishing}},

organization = {Springer, Cham},

abstract = {Numerical simulations present challenges because they generate petabyte-scale data that must be extracted and reduced during the simulation. We demonstrate a seamless integration of feature extraction for a simulation of turbulent fluid dynamics. The simulation produces on the order of 6 terabytes per timestep. In order to analyze and store this data, we extract velocity data from a dilated volume of the strong vortical regions and also store a lossy compressed representation of the data. Both reduce data by one or more orders of magnitude. We extract data from user checkpoints in transit while they reside on temporary burst buffer SSD stores. In this way, analysis and compression algorithms are designed to meet specific time constraints so they do not interfere with simulation computations. Our results demonstrate that we can perform feature extraction on a world-class direct numerical simulation of turbulence while it is running and gather meaningful scientific data for archival and post analysis.},

keywords = {},

pubstate = {published},

tppubtype = {inproceedings}

}
Berres, Anne; Turton, Terece; Rogers, David; Ahrens, James; Petersen, Mark
Video Compression for Ocean Simulation Image Databases Proceedings Article
In: Rink, Karsten; Middel, Ariane; Zeckzer, Dirk; Bujack, Roxana (Ed.): Workshop on Visualization in Environmental Sciences (EnvirVis), The Eurographics Association, 2017, ISBN: 978-3-03868-040-6, (LA-UR-17-21590).
@inproceedings{info:lanl-repo/lareport/LA-UR-17-21590,

title = {Video Compression for Ocean Simulation Image Databases},

author = {Anne Berres and Terece Turton and David Rogers and James Ahrens and Mark Petersen},

editor = {Karsten Rink and Ariane Middel and Dirk Zeckzer and Roxana Bujack},

url = {http://datascience.dsscale.org/wp-content/uploads/2017/08/VideoCompressionforOceanSimulationImageDatabases.pdf},

doi = {10.2312/envirvis.20171104},

isbn = {978-3-03868-040-6},

year  = {2017},

date = {2017-01-01},

booktitle = {Workshop on Visualization in Environmental Sciences (EnvirVis)},

publisher = {The Eurographics Association},

abstract = {Climate research requires monitoring a large range of spatial and temporal scales to understand the climate system and potential future impacts. Climate simulations are now run with very high resolution (1–10 km gridcells) ocean, sea ice, and atmosphere components, and can easily produce petabytes of output. This overloads storage systems and hinders visualization and analysis. Image databases can decrease storage sizes from petabytes of simulation output down to several hundred gigabytes of images.

In this paper, we introduce video compression as a method to further decrease database sizes by 2-4 orders of magnitude. We compare compression and access speeds, compressed sizes, and compression quality over a range of settings. Quality is assessed through image quality metrics and expert feedback. Overall, we were able to show that video compression techniques provide an efficient means of storing image databases at a shareable size, while preserving image quality. This enables the wise use of available disk space, so scientists can more easily study the physical features of interest.},

howpublished = {Visualization in Environmental Sciences 2017 ; 2017-06-12 - 2017-06-13 ; Barcelona, Spain},

note = {LA-UR-17-21590},

keywords = {},

pubstate = {published},

tppubtype = {inproceedings}

}
In this paper, we introduce video compression as a method to further decrease database sizes by 2-4 orders of magnitude. We compare compression and access speeds, compressed sizes, and compression quality over a range of settings. Quality is assessed through image quality metrics and expert feedback. Overall, we were able to show that video compression techniques provide an efficient means of storing image databases at a shareable size, while preserving image quality. This enables the wise use of available disk space, so scientists can more easily study the physical features of interest.
Ware, Colin; Turton, Terece; Samsel, Francesca; Bujack, Roxana; Rogers, David
Evaluating the Perceptual Uniformity of Color Sequences for Feature Discrimination Proceedings Article
In: Lawonn, Kai; Smit, Noeska; Cunningham, Douglas (Ed.): EuroVis Workshop on Reproducibility, Verification, and Validation in Visualization (EuroRV3), The Eurographics Association, 2017, ISBN: 978-3-03868-041-3, (LA-UR-17-24206).
@inproceedings{eurorv3.20171107,

title = {Evaluating the Perceptual Uniformity of Color Sequences for Feature Discrimination},

author = {Colin Ware and Terece Turton and Francesca Samsel and Roxana Bujack and David Rogers},

editor = {Kai Lawonn and Noeska Smit and Douglas Cunningham},

url = {https://diglib.eg.org/handle/10.2312/eurorv320171107},

isbn = {978-3-03868-041-3},

year  = {2017},

date = {2017-01-01},

booktitle = {EuroVis Workshop on Reproducibility, Verification, and Validation in Visualization (EuroRV3)},

publisher = {The Eurographics Association},

abstract = {Probably the most common method for visualizing univariate data maps is through pseudocoloring and one of the most commonly cited requirements of a good colormap is that it be perceptually uniform. This means that differences between adjacent colors in the sequence be equally distinct. The practical value of uniformity is for features in the data to be equally distinctive no matter where they lie in the colormap, but there are reasons for thinking that uniformity in terms of feature detection may not be achieved by current methods which are based on the use of uniform color spaces. In this paper we provide a new method for directly evaluating colormaps in terms of their capacity for feature resolution. We apply the method in a study using Amazon Mechanical Turk to evaluate seven colormaps. Among other findings the results show that two new double ended sequences have the highest discriminative power and good uniformity. Ways in which the technique can be applied include the design of colormaps for uniformity, and a method for evaluating colormaps through feature discrimination curves for differently sized features.},

note = {LA-UR-17-24206},

keywords = {},

pubstate = {published},

tppubtype = {inproceedings}

}
Patchett, John; Nouanesengsy, Boonthanome; Fasel, Patricia; Ahrens, James
2016 CSSE L3 Milestone: Deliver In Situ to XTD End Users Technical Report
2016, (LA-UR-16-26987).
@techreport{Patchett2016,

title = {2016 CSSE L3 Milestone: Deliver In Situ to XTD End Users},

author = {John Patchett and Boonthanome Nouanesengsy and Patricia Fasel and James Ahrens},

url = {http://datascience.dsscale.org/wp-content/uploads/2016/10/DeliverInSituToXTDEndUsers.pdf},

year  = {2016},

date = {2016-09-13},

abstract = {This report summarizes the activities in FY16 toward satisfying the CSSE 2016 L3 milestone to deliver in situ to XTD end users of EAP codes. The Milestone was accomplished with ongoing work to ensure the capability is maintained and developed. Two XTD end users used the in situ capability in Rage. A production ParaView capability was created in the HPC and Desktop environment. Two new capabilities were added to ParaView in support of an EAP in situ workflow.

We also worked with various support groups at the lab to deploy a production ParaView in the LANL environment for both desktop and HPC systems. . In addition, for this milestone, we moved two VTK based filters from research objects into the production ParaView code to support a variety of standard visualization pipelines for our EAP codes.},

note = {LA-UR-16-26987},

keywords = {},

pubstate = {published},

tppubtype = {techreport}

}
We also worked with various support groups at the lab to deploy a production ParaView in the LANL environment for both desktop and HPC systems. . In addition, for this milestone, we moved two VTK based filters from research objects into the production ParaView code to support a variety of standard visualization pipelines for our EAP codes.
Moreland, Kenneth; Sewell, Christopher; Usher, William; Lo, Li-ta; Meredith, Jeremy; Pugmire, David; Kress, James; Schroots, Hendrik; Ma, Kwan-Liu; Childs, Hank; Larsen, Matthew; Chen, Chun-Ming; Maynard, Robert; Geveci, Berk
VTK-m: Accelerating the Visualization Toolkit for Massively Threaded Architectures Proceedings Article
In: pp. 48-58, IEEE Computer Graphics and Applications, 2016, ISSN: 0272-1716, (LA-UR-15-27306).
@inproceedings{Moreland:2016a,

title = {VTK-m: Accelerating the Visualization Toolkit for Massively Threaded Architectures},

author = {Kenneth Moreland and Christopher Sewell and William Usher and Li-ta Lo and Jeremy Meredith and David Pugmire and James Kress and Hendrik Schroots and Kwan-Liu Ma and Hank Childs and Matthew Larsen and Chun-Ming Chen and Robert Maynard and Berk Geveci},

url = {http://ieeexplore.ieee.org/xpl/articleDetails.jsp?arnumber=7466740},

issn = {0272-1716},

year  = {2016},

date = {2016-05-01},

pages = {48-58},

publisher = {IEEE Computer Graphics and Applications},

abstract = {One of the most critical challenges for high-performance computing (HPC) scientific visualization is execution on massively threaded processors. Of the many fundamental changes we are seeing in HPC systems, one of the most profound is a reliance on new processor types optimized for execution bandwidth over latency hiding. Our current production scientific visualization software is not designed for these new types of architectures. To address this issue, the VTK-m framework serves as a container for algorithms, provides flexible data representation, and simplifies the design of visualization algorithms on new and future computer architecture.},

note = {LA-UR-15-27306},

keywords = {},

pubstate = {published},

tppubtype = {inproceedings}

}
Ware, Colin; Rogers, David; Petersen, Mark; Ahrens, James; Aygar, Erol
Optimizing for Visual Cognition in High Performance Scientific Computing Journal Article
In: Electronic Imaging, vol. 2016, no. 16, pp. 1–9, 2016, ISSN: 2470-1173.
@article{ware2016optimizing,

title = {Optimizing for Visual Cognition in High Performance Scientific Computing},

author = {Colin Ware and David Rogers and Mark Petersen and James Ahrens and Erol Aygar},

url = {http://www.ingentaconnect.com/content/ist/ei/2016/00002016/00000016/art00041},

doi = {doi:10.2352/ISSN.2470-1173.2016.16.HVEI-130},

issn = {2470-1173},

year  = {2016},

date = {2016-02-14},

journal = {Electronic Imaging},

volume = {2016},

number = {16},

pages = {1--9},

publisher = {Society for Imaging Science and Technology},

abstract = {High performance scientific computing is undergoing radical changes as we move to Exascale (1018 FLOPS) and as a consequence products for visualization must increasingly be generated in-situ as opposed to after a model run. This changes both the nature of the data products and the overall cognitive work flow. Currently, data is saved in the form of model dumps, but these are both extremely large and not ideal for visualization. Instead, we need methods for saving model data in ways that are both compact and optimized for visualization. For example, our results show that animated representations are more perceptually efficient than static views even for steady flows, so we need ways of compressing vector field data for animated visualization. Another example, motion parallax is essential to perceive structures in dark matter simulations, so we need ways of saving large particle systems optimized for perception. Turning to the cognitive work flow, when scientists and engineers allocate their time to high performance computer simulations their effort is distributed between pre and post run work. To better understand the tradeoffs we created an analytics game to model the optimization of high performance computer codes simulating ocean dynamics. Visualization is a key part of this process. The results from two analytics game experiments suggest that simple changes can have a large impact on overall cognitive efficiency. Our first experiment showed that study participants continued to look at images for much longer than optimal. A second experiment revealed a large reduction in cognitive efficiency as working memory demands increased. We conclude with recommendations for systems design.},

keywords = {},

pubstate = {published},

tppubtype = {article}

}
Widanagamaachchi, Wathsala; Hammond, Karl D.; Lo, Li-Ta; Wirth, Brian D.; Samsel, Francesca; Sewell, Christopher; Ahrens, James; Pascucci, Valerio
Visualization of Large-Scale Atomistic Simulations of Plasma-Surface Interactions Proceedings Article
In: Proceedings of EuroVis (short paper), Cagliari, Italy, 2015, (LA-UR-15-21194).
@inproceedings{Widanagamaachchi:2015a,

title = {Visualization of Large-Scale Atomistic Simulations of Plasma-Surface Interactions},

author = {Wathsala Widanagamaachchi and Karl D. Hammond and Li-Ta Lo and Brian D. Wirth and Francesca Samsel and Christopher Sewell and James Ahrens and Valerio Pascucci},

url = {http://datascience.dsscale.org/wp-content/uploads/2016/06/VisualizationAndAnalysisOfLarge-ScaleAtomisticSimulationsOfPlasma-SurfaceInteractions.pdf},

year  = {2015},

date = {2015-05-01},

booktitle = {Proceedings of EuroVis (short paper)},

address = {Cagliari, Italy},

abstract = {We present a simulation–visualization pipeline that uses the LAMMPS Molecular Dynamics Simulator and the Visualization Toolkit to create a visualization and analysis environment for atomistic simulations of plasma–surface interactions. These simulations are used to understand the origin of fuzz-like, microscopic damage to tungsten and other metal surfaces by helium. The proposed pipeline serves both as an aid to visualization, i.e. drawing the surfaces of gas bubbles and voids/cavities in the metal, as well as a means of analysis, i.e. extracting various statistics and gas bubble evolution details. The result is a better understanding of the void and bubble formation process that is difficult if not impossible to get using conventional atomistic visualization software.},

note = {LA-UR-15-21194},

keywords = {},

pubstate = {published},

tppubtype = {inproceedings}

}
Adhinarayanan, Vignesh; Feng, Wu-chun; Woodring, Jonathan; Rogers, David; Ahrens, James
On the Greenness of In-Situ and Post-Processing Visualization Pipelines Proceedings Article
In: 11th workshop on High-Performance, Power-Aware Computing (HPPAC), Hyderabad, India, 2015, (LA-UR-15-21414).
@inproceedings{vignesh-in-situ-hppac15,

title = {On the Greenness of In-Situ and Post-Processing Visualization Pipelines},

author = {Vignesh Adhinarayanan and Wu-chun Feng and Jonathan Woodring and David Rogers and James Ahrens},

url = {http://datascience.dsscale.org/wp-content/uploads/2016/06/OnTheGreenessOfIn-SituAndPost-ProcessingVisualizationPipelines.pdf},

year  = {2015},

date = {2015-05-01},

booktitle = {11th workshop on High-Performance, Power-Aware Computing (HPPAC)},

address = {Hyderabad, India},

abstract = {Post-processing visualization pipelines are tradi- tionally used to gain insight from simulation data. However, changes to the system architecture for high-performance com- puting (HPC), dictated by the exascale goal, have limited the applicability of post-processing visualization. As an alternative, in-situ pipelines are proposed in order to enhance the knowl- edge discovery process via “real-time” visualization. Quantitative studies have already shown how in-situ visualization can improve performance and reduce storage needs at the cost of scientific exploration capabilities. However, to fully understand the trade- off space, a head-to-head comparison of power and energy (between the two types of visualization pipelines) is necessary. Thus, in this work, we study the greenness (i.e., power, energy, and energy efficiency) of the in-situ and the post-processing visualization pipelines, using a proxy heat-transfer simulation as an example. For a realistic I/O load, the in-situ pipeline consumes 43% less energy than the post-processing pipeline. Contrary to expectations, our findings also show that only 9% of the total energy is saved by reducing off-chip data movement, while the rest of the savings comes from reducing the system idle time. This suggests an alternative set of optimization techniques for reducing the power consumption of the traditional post- processing pipeline.},

note = {LA-UR-15-21414},

keywords = {},

pubstate = {published},

tppubtype = {inproceedings}

}
Samsel, Francesca; Petersen, Mark; Abram, Greg; Turton, Terece; Rogers, David; Ahrens, James
Visualization of ocean currents and eddies in a high-resolution global ocean-climate model Proceedings Article
In: Proceedings of the International Conference on High Performance Computing, Networking, Storage and Analysis 2015, 2015, (LA-UR-15-20105).
@inproceedings{samsel2015visualization,

title = {Visualization of ocean currents and eddies in a high-resolution global ocean-climate model},

author = {Francesca Samsel and Mark Petersen and Greg Abram and Terece Turton and David Rogers and James Ahrens},

url = {http://datascience.dsscale.org/wp-content/uploads/2017/08/VisualizationofOceanCurrentsandEddiesinaHigh-resoutionOceanModel.pdf},

year  = {2015},

date = {2015-01-01},

booktitle = {Proceedings of the International Conference on High Performance Computing, Networking, Storage and Analysis 2015},

abstract = {Climate change research relies on models to better understand and predict the complex, interdependent processes that affect the atmosphere, ocean, and land. These models are computationally intensive and produce terabytes to petabytes of data. Visualization and analysis is increasingly difficult, yet is critical to gain scientific insights from large simulations. The recently-developed Model for Prediction Across Scales-Ocean (MPAS-Ocean) is designed to investigate climate change at global high-resolution (5 to 10 km grid cells) on high performance computing platforms. In the accompanying video, we use state-of-the-art visualization techniques to explore the physical processes in the ocean relevant to climate change. These include heat transport, turbulence and eddies, weakening of the meridional overturning circulation, and interaction between a warming ocean and Antarctic ice shelves. The project exemplifies the benefits of tight collaboration among scientists, artists, computer scientists, and visualization specialists.},

note = {LA-UR-15-20105},

keywords = {},

pubstate = {published},

tppubtype = {inproceedings}

}
Zeyen, Max
Material Science - Crystal Grain Visualization Presentation
01.10.2014, (LA-UR-pending).
@misc{Zeyen2014,

title = {Material Science - Crystal Grain Visualization},

author = {Max Zeyen},

url = {http://datascience.dsscale.org/wp-content/uploads/2016/08/Material_Science-Crystal_Grain_Visualization.pdf},

year  = {2014},

date = {2014-10-01},

abstract = {This presentation summarizes Max Zeyen's material science project on crystal grain visualization.},

note = {LA-UR-pending},

keywords = {},

pubstate = {published},

tppubtype = {presentation}

}
Widanagamaachchi, Wathsala
In-situ Visualization and Analysis of Plasma Surface Interaction Simulations Presentation
01.10.2014, (LA-UR-pending).
@misc{Widanagamaachchi2014,

title = {In-situ Visualization and Analysis of Plasma Surface Interaction Simulations},

author = {Wathsala Widanagamaachchi

},

url = {http://datascience.dsscale.org/wp-content/uploads/2016/08/In-situ_Visualization_and_Analysis_Of_Plasma_Surface_Interaction_Simulations.pptx},

year  = {2014},

date = {2014-10-01},

abstract = {This presentation summarized Wathsala Widanagamaachchi's in-situ visualization and analysis summer 2014 project.},

note = {LA-UR-pending},

keywords = {},

pubstate = {published},

tppubtype = {presentation}

}
Childs, Hank
Research challenges for visualization software Technical Report
2014.
@techreport{Childs2014,

title = {Research challenges for visualization software},

author = {Hank Childs},

url = {http://datascience.dsscale.org/wp-content/uploads/2016/06/ResearchChallengesForVisualizationSoftware.pdf},

year  = {2014},

date = {2014-01-01},

journal = {IEEE Computer, 46, May 2013},

abstract = {As the visualization research community reorients its software to address upcoming challenges, it must successfully deal with diverse processor architectures, distributed systems, various data sources, massive parallelism, multiple input and output devices, and interactivity.},

keywords = {},

pubstate = {published},

tppubtype = {techreport}

}