2015
Bryan, Christopher; Wu, Xue; Mniszewski, Susan; Ma, Kwan-Liu
Integrating predictive analytics into a spatiotemporal epidemic simulation Proceedings Article
In: 2015 IEEE Conference on Visual Analytics Science and Technology, VAST 2015, Chicago, IL, USA, October 25-30, 2015, pp. 17–24, 2015, (LA-UR-15-24873).
Abstract | Links | BibTeX | Tags: Epidemic Visualization, Predictive Modeling, Spatial-Temporal Systems, Visual analytics
@inproceedings{DBLP:conf/ieeevast/BryanWMM15,

title = {Integrating predictive analytics into a spatiotemporal epidemic simulation},

author = {Christopher Bryan and Xue Wu and Susan Mniszewski and Kwan-Liu Ma},

url = {http://dx.doi.org/10.1109/VAST.2015.7347626},

doi = {10.1109/VAST.2015.7347626},

year  = {2015},

date = {2015-01-01},

booktitle = {2015 IEEE Conference on Visual Analytics Science and Technology, VAST 2015, Chicago, IL, USA, October 25-30, 2015},

pages = {17--24},

crossref = {DBLP:conf/ieeevast/2015},

abstract = {The Epidemic Simulation System (EpiSimS) is a scalable, complex modeling tool for analyzing disease within the United States. Due to its high input dimensionality, time requirements, and resource constraints, simulating over the entire parameter space is unfeasible. One solution is to take a granular sampling of the input space and use simpler predictive models (emulators) in between. The quality of the implemented emulator depends on many factors: its robustness, sophistication, configuration settings, and suitability to the input data. Visual analytics (VA) can be leveraged to provide guidance and understanding to the user. In this paper, we have implemented a novel VA interface and workflow for emulator building and use. We introduce a workflow to build emulators, make predictions, and then analyze the results. Our prediction process first predicts temporal time series, and uses these to derive predicted spatial densities. Integrated into the EpiSimS framework, we target users who are non-experts at statistical modeling. This approach allows for a high level of analysis into the state of the built emulators and their resultant predictions. We present our workflow, models and the associated VA system, and evaluate the overall utility with feedback from EpiSimS scientists.},

note = {LA-UR-15-24873},

keywords = {Epidemic Visualization, Predictive Modeling, Spatial-Temporal Systems, Visual analytics},

pubstate = {published},

tppubtype = {inproceedings}

}
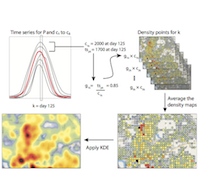
The Epidemic Simulation System (EpiSimS) is a scalable, complex modeling tool for analyzing disease within the United States. Due to its high input dimensionality, time requirements, and resource constraints, simulating over the entire parameter space is unfeasible. One solution is to take a granular sampling of the input space and use simpler predictive models (emulators) in between. The quality of the implemented emulator depends on many factors: its robustness, sophistication, configuration settings, and suitability to the input data. Visual analytics (VA) can be leveraged to provide guidance and understanding to the user. In this paper, we have implemented a novel VA interface and workflow for emulator building and use. We introduce a workflow to build emulators, make predictions, and then analyze the results. Our prediction process first predicts temporal time series, and uses these to derive predicted spatial densities. Integrated into the EpiSimS framework, we target users who are non-experts at statistical modeling. This approach allows for a high level of analysis into the state of the built emulators and their resultant predictions. We present our workflow, models and the associated VA system, and evaluate the overall utility with feedback from EpiSimS scientists.
: . .
1.
Bryan, Christopher; Wu, Xue; Mniszewski, Susan; Ma, Kwan-Liu
Integrating predictive analytics into a spatiotemporal epidemic simulation Proceedings Article
In: 2015 IEEE Conference on Visual Analytics Science and Technology, VAST 2015, Chicago, IL, USA, October 25-30, 2015, pp. 17–24, 2015, (LA-UR-15-24873).
@inproceedings{DBLP:conf/ieeevast/BryanWMM15,

title = {Integrating predictive analytics into a spatiotemporal epidemic simulation},

author = {Christopher Bryan and Xue Wu and Susan Mniszewski and Kwan-Liu Ma},

url = {http://dx.doi.org/10.1109/VAST.2015.7347626},

doi = {10.1109/VAST.2015.7347626},

year  = {2015},

date = {2015-01-01},

booktitle = {2015 IEEE Conference on Visual Analytics Science and Technology, VAST 2015, Chicago, IL, USA, October 25-30, 2015},

pages = {17--24},

crossref = {DBLP:conf/ieeevast/2015},

abstract = {The Epidemic Simulation System (EpiSimS) is a scalable, complex modeling tool for analyzing disease within the United States. Due to its high input dimensionality, time requirements, and resource constraints, simulating over the entire parameter space is unfeasible. One solution is to take a granular sampling of the input space and use simpler predictive models (emulators) in between. The quality of the implemented emulator depends on many factors: its robustness, sophistication, configuration settings, and suitability to the input data. Visual analytics (VA) can be leveraged to provide guidance and understanding to the user. In this paper, we have implemented a novel VA interface and workflow for emulator building and use. We introduce a workflow to build emulators, make predictions, and then analyze the results. Our prediction process first predicts temporal time series, and uses these to derive predicted spatial densities. Integrated into the EpiSimS framework, we target users who are non-experts at statistical modeling. This approach allows for a high level of analysis into the state of the built emulators and their resultant predictions. We present our workflow, models and the associated VA system, and evaluate the overall utility with feedback from EpiSimS scientists.},

note = {LA-UR-15-24873},

keywords = {},

pubstate = {published},

tppubtype = {inproceedings}

}
The Epidemic Simulation System (EpiSimS) is a scalable, complex modeling tool for analyzing disease within the United States. Due to its high input dimensionality, time requirements, and resource constraints, simulating over the entire parameter space is unfeasible. One solution is to take a granular sampling of the input space and use simpler predictive models (emulators) in between. The quality of the implemented emulator depends on many factors: its robustness, sophistication, configuration settings, and suitability to the input data. Visual analytics (VA) can be leveraged to provide guidance and understanding to the user. In this paper, we have implemented a novel VA interface and workflow for emulator building and use. We introduce a workflow to build emulators, make predictions, and then analyze the results. Our prediction process first predicts temporal time series, and uses these to derive predicted spatial densities. Integrated into the EpiSimS framework, we target users who are non-experts at statistical modeling. This approach allows for a high level of analysis into the state of the built emulators and their resultant predictions. We present our workflow, models and the associated VA system, and evaluate the overall utility with feedback from EpiSimS scientists.