2015
Carr, Hamish; Sewell, Christopher; Lo, Li-Ta; james Ahrens,
Hybrid Data-Parallel Contour Tree Computation Proceedings Article
In: 2015, (LA-UR-15-24759).
Abstract | Links | BibTeX | Tags: and object reppresentations, computational geometry and object modeling, contour tree, data-parallel, gpu, multi-core, nvidia thrust, simulation output analysis, solid, surface, topological analysis
@inproceedings{Carr2015,
title = {Hybrid Data-Parallel Contour Tree Computation},
author = {Hamish Carr and Christopher Sewell and Li-Ta Lo and james Ahrens},
url = {http://datascience.dsscale.org/wp-content/uploads/2016/06/HybridData-ParallelContourTreeComputaion.pdf},
year = {2015},
date = {2015-01-01},
number = {LA-UR-15-24759},
institution = {Los Alamos National Laboratory},
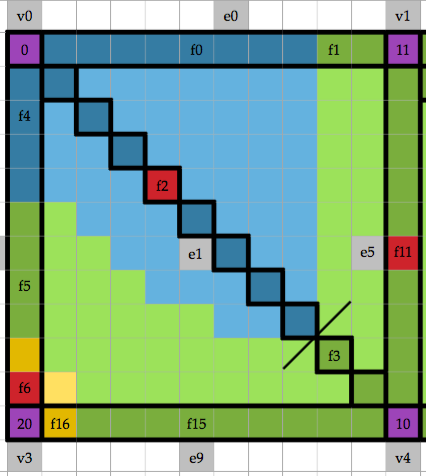
abstract = {As data sets increase in size beyond the petabyte, it is increasingly important to have automated methods for data analysis and visualization. While topological analysis tools such as the contour tree and Morse-Smale complex are now well established, there is still a shortage of efficient parallel algorithms for their computation, in particular for massively data-parallel computation on a SIMD model. We report the first data-parallel algorithm for computing the fully augmented contour tree, using a quantized computation model. We then extend this to provide a hybrid data-parallel / distributed algorithm allowing scaling beyond a single GPU or CPU, and provide results for its computation. Our implementation uses the portable data-parallel primitives provided by Nvidia’s Thrust library, allowing us to compile our same code for both GPUs and multi-core CPUs.},
note = {LA-UR-15-24759},
keywords = {and object reppresentations, computational geometry and object modeling, contour tree, data-parallel, gpu, multi-core, nvidia thrust, simulation output analysis, solid, surface, topological analysis},
pubstate = {published},
tppubtype = {inproceedings}
}
2012
Williams, Sean; Petersen, Mark; Hecht, Matthew; Maltrud, Mathew; Hamann, Bernd; Patchett, John; Ahrens, James; Hamann, Bernd
Interface Exchange as an Indicator for Eddy Heat Transport Proceedings Article
In: Computer Graphics Forum, pp. 1125-1134, Wiley Online Library 2012, (LA-UR-12-21038).
Abstract | Links | BibTeX | Tags: applications, eddies, interface exchange, Ocean General Circulation Models, oceanography simulation and modeling, simulation output analysis
@inproceedings{williams2012interface,
title = {Interface Exchange as an Indicator for Eddy Heat Transport},
author = {Sean Williams and Mark Petersen and Matthew Hecht and Mathew Maltrud and Bernd Hamann and John Patchett and James Ahrens and Bernd Hamann },
url = {http://datascience.dsscale.org/wp-content/uploads/2016/06/InterfaceExchangeAsAnIndicatorForEddyHeatTransport.pdf},
year = {2012},
date = {2012-01-01},
booktitle = {Computer Graphics Forum},
volume = {31},
number = {3pt3},
pages = {1125-1134},
organization = {Wiley Online Library},
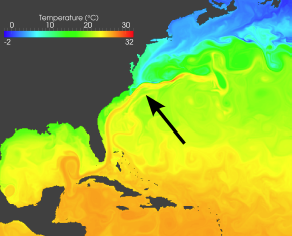
abstract = {The ocean contains many large-scale, long-lived vortices, called mesoscale eddies, that are believed to have a role in the transport and redistribution of salt, heat, and nutrients throughout the ocean. Determining this role, however, has proven to be a challenge, since the mechanics of eddies are only partly understood; a standard definition for these ocean eddies does not exist and, therefore, scientifically meaningful, robust methods for eddy extraction, characterization, tracking and visualization remain a challenge. To shed light on the nature and potential roles of eddies, we extend our previous work on eddy identification and tracking to construct a new metric to characterize the transfer of water into and out of eddies across their boundary, and produce several visualizations of this new metric to provide clues about the role eddies play in the global ocean.},
note = {LA-UR-12-21038},
keywords = {applications, eddies, interface exchange, Ocean General Circulation Models, oceanography simulation and modeling, simulation output analysis},
pubstate = {published},
tppubtype = {inproceedings}
}
2011
Williams, Sean; Hecht, Matthew; Petersen, Mark; Strelitz, Richard; Maltrud, Mathew; Ahrens, James; Hlawitschka, Mario; Hamann, Bernd
Visualization and analysis of eddies in a global ocean simulation Proceedings Article
In: Computer Graphics Forum, pp. 991–1000, Wiley Online Library 2011, (LA-UR-11-02104).
Abstract | Links | BibTeX | Tags: Ocean General Circulation Models, oceanography simulation and modeling, simulation output analysis
@inproceedings{williams2011visualization,

title = {Visualization and analysis of eddies in a global ocean simulation},

author = {Sean Williams and Matthew Hecht and Mark Petersen and Richard Strelitz and Mathew Maltrud and James Ahrens and Mario Hlawitschka and Bernd Hamann},

url = {http://datascience.dsscale.org/wp-content/uploads/2016/06/VisualizationAndAnalysisOfEddiesInAGlobalOceanSimulation.pdf},

year  = {2011},

date = {2011-01-01},

booktitle = {Computer Graphics Forum},

volume = {30},

number = {3},

pages = {991--1000},

organization = {Wiley Online Library},

abstract = {We present analysis and visualization of flow data from a high-resolution sim ulation of the dynamical behavior of the global ocean. Of particular scientific interest are coherent vortical features called mesoscale eddies. We first extract high-vorticity features using a metric from the oceanography comm unity called the Okubo-Weiss parameter. We then use a new circularity criterion to differentiate eddies from other no n-eddy features like meanders in strong background currents. From these data, we generate visualizatio ns showing the three-dimensional structure and distribution of ocean eddies. Additionally, the characteristics of each e ddy are recorded to form an eddy census that can be used to investigate correlations among variables such as e ddy thickness, depth, and location. From these analyses, we gain insight into the role eddies play in large-scale ocea n circulation.},

note = {LA-UR-11-02104},

keywords = {Ocean General Circulation Models, oceanography simulation and modeling, simulation output analysis},

pubstate = {published},

tppubtype = {inproceedings}

}
1998
McCormick, Patrick; Ahrens, James
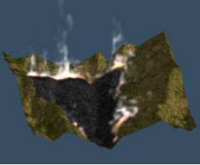
Visualization of wildfire simulations Journal Article
In: Computer Graphics and Applications, IEEE, vol. 18, no. 2, pp. 17–19, 1998, (LA-UR-98-0646).
Abstract | Links | BibTeX | Tags: simulation, simulation output analysis, wildfire
@article{mccormick1998visualization,
title = {Visualization of wildfire simulations},
author = {Patrick McCormick and James Ahrens },
url = {http://datascience.dsscale.org/wp-content/uploads/2016/06/VisualizationOfWildfireSimulations.pdf},
year = {1998},
date = {1998-01-01},
journal = {Computer Graphics and Applications, IEEE},
volume = {18},
number = {2},
pages = {17--19},
publisher = {IEEE},
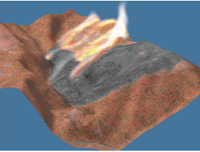
abstract = {Newspaper headlines constantly remind us of the human and property losses we suffer from wildfires, severe storms, earthquakes, and other natural disasters. These disasters cost the United States hundreds of lives and billions of dollars annually. Scientists at Los Alamos National Laboratory are developing computer models to predict the evolution of such disasters. Predicting the course of these events in faster than real time permits developing management strategies to minimize their adverse consequences. Presently, the complexity of models that forecast crises requires the advanced computing systems available at Los Alamos. In the near future, these models will be adapted for use in planning, training, and operational situations, but will still require advanced computing systems to run.},
note = {LA-UR-98-0646},
keywords = {simulation, simulation output analysis, wildfire},
pubstate = {published},
tppubtype = {article}
}
1997
Ahrens, James; McCormick, Patrick; Bossert, James; Reisner, Jon; Winterkamp, Judith
Case study: Wildfire visualization Proceedings Article
In: Visualization'97., Proceedings, pp. 451–454, IEEE 1997, (LA-UR-97-2761).
Abstract | Links | BibTeX | Tags: simulation, simulation output analysis, wildfire
@inproceedings{ahrens1997case,

title = {Case study: Wildfire visualization},

author = {James Ahrens and Patrick McCormick and James Bossert and Jon Reisner and Judith Winterkamp},

url = {http://datascience.dsscale.org/wp-content/uploads/2016/06/CaseStudyWildfireVisualization.pdf},

year  = {1997},

date = {1997-01-01},

booktitle = {Visualization'97., Proceedings},

pages = {451--454},

organization = {IEEE},

abstract = {The ability to forecast the progress of crisis events would significantly reduce human suffering and loss of life, the destruction of property, and expenditures for assessment and recovery. Los Alamos National Laboratory has established a scientific thrust in crisis forecasting to address this national challenge. In the initial phase of this project, scientists at Los Alamos are developing computer models to predict the spread of a wildfire. Visualization of the results of the wildfire simulation will be used by scientists to assess the quality of the simulation and eventually by fire personnel as a visual forecast of the wildfire’s evolution. The fire personnel and scientists want the visualization to look as realistic as possible without compromising scientific accuracy. This paper describes how the visualization was created, analyzes the tools and approach that was used, and suggests directions for future work and research.},

note = {LA-UR-97-2761},

keywords = {simulation, simulation output analysis, wildfire},

pubstate = {published},

tppubtype = {inproceedings}

}
Carr, Hamish; Sewell, Christopher; Lo, Li-Ta; james Ahrens,
Hybrid Data-Parallel Contour Tree Computation Proceedings Article
In: 2015, (LA-UR-15-24759).
@inproceedings{Carr2015,

title = {Hybrid Data-Parallel Contour Tree Computation},

author = {Hamish Carr and Christopher Sewell and Li-Ta Lo and james Ahrens},

url = {http://datascience.dsscale.org/wp-content/uploads/2016/06/HybridData-ParallelContourTreeComputaion.pdf},

year  = {2015},

date = {2015-01-01},

number = {LA-UR-15-24759},

institution = {Los Alamos National Laboratory},

abstract = {As data sets increase in size beyond the petabyte, it is increasingly important to have automated methods for data analysis and visualization. While topological analysis tools such as the contour tree and Morse-Smale complex are now well established, there is still a shortage of efficient parallel algorithms for their computation, in particular for massively data-parallel computation on a SIMD model. We report the first data-parallel algorithm for computing the fully augmented contour tree, using a quantized computation model. We then extend this to provide a hybrid data-parallel / distributed algorithm allowing scaling beyond a single GPU or CPU, and provide results for its computation. Our implementation uses the portable data-parallel primitives provided by Nvidia’s Thrust library, allowing us to compile our same code for both GPUs and multi-core CPUs.},

note = {LA-UR-15-24759},

keywords = {},

pubstate = {published},

tppubtype = {inproceedings}

}
Williams, Sean; Petersen, Mark; Hecht, Matthew; Maltrud, Mathew; Hamann, Bernd; Patchett, John; Ahrens, James; Hamann, Bernd
Interface Exchange as an Indicator for Eddy Heat Transport Proceedings Article
In: Computer Graphics Forum, pp. 1125-1134, Wiley Online Library 2012, (LA-UR-12-21038).
@inproceedings{williams2012interface,

title = {Interface Exchange as an Indicator for Eddy Heat Transport},

author = {Sean Williams and Mark Petersen and Matthew Hecht and Mathew Maltrud and Bernd Hamann and John Patchett and James Ahrens and Bernd Hamann },

url = {http://datascience.dsscale.org/wp-content/uploads/2016/06/InterfaceExchangeAsAnIndicatorForEddyHeatTransport.pdf},

year  = {2012},

date = {2012-01-01},

booktitle = {Computer Graphics Forum},

volume = {31},

number = {3pt3},

pages = {1125-1134},

organization = {Wiley Online Library},

abstract = {The ocean contains many large-scale, long-lived vortices, called mesoscale eddies, that are believed to have a role in the transport and redistribution of salt, heat, and nutrients throughout the ocean. Determining this role, however, has proven to be a challenge, since the mechanics of eddies are only partly understood; a standard definition for these ocean eddies does not exist and, therefore, scientifically meaningful, robust methods for eddy extraction, characterization, tracking and visualization remain a challenge. To shed light on the nature and potential roles of eddies, we extend our previous work on eddy identification and tracking to construct a new metric to characterize the transfer of water into and out of eddies across their boundary, and produce several visualizations of this new metric to provide clues about the role eddies play in the global ocean.},

note = {LA-UR-12-21038},

keywords = {},

pubstate = {published},

tppubtype = {inproceedings}

}
Williams, Sean; Hecht, Matthew; Petersen, Mark; Strelitz, Richard; Maltrud, Mathew; Ahrens, James; Hlawitschka, Mario; Hamann, Bernd
Visualization and analysis of eddies in a global ocean simulation Proceedings Article
In: Computer Graphics Forum, pp. 991–1000, Wiley Online Library 2011, (LA-UR-11-02104).
@inproceedings{williams2011visualization,

title = {Visualization and analysis of eddies in a global ocean simulation},

author = {Sean Williams and Matthew Hecht and Mark Petersen and Richard Strelitz and Mathew Maltrud and James Ahrens and Mario Hlawitschka and Bernd Hamann},

url = {http://datascience.dsscale.org/wp-content/uploads/2016/06/VisualizationAndAnalysisOfEddiesInAGlobalOceanSimulation.pdf},

year  = {2011},

date = {2011-01-01},

booktitle = {Computer Graphics Forum},

volume = {30},

number = {3},

pages = {991--1000},

organization = {Wiley Online Library},

abstract = {We present analysis and visualization of flow data from a high-resolution sim ulation of the dynamical behavior of the global ocean. Of particular scientific interest are coherent vortical features called mesoscale eddies. We first extract high-vorticity features using a metric from the oceanography comm unity called the Okubo-Weiss parameter. We then use a new circularity criterion to differentiate eddies from other no n-eddy features like meanders in strong background currents. From these data, we generate visualizatio ns showing the three-dimensional structure and distribution of ocean eddies. Additionally, the characteristics of each e ddy are recorded to form an eddy census that can be used to investigate correlations among variables such as e ddy thickness, depth, and location. From these analyses, we gain insight into the role eddies play in large-scale ocea n circulation.},

note = {LA-UR-11-02104},

keywords = {},

pubstate = {published},

tppubtype = {inproceedings}

}
McCormick, Patrick; Ahrens, James
Visualization of wildfire simulations Journal Article
In: Computer Graphics and Applications, IEEE, vol. 18, no. 2, pp. 17–19, 1998, (LA-UR-98-0646).
@article{mccormick1998visualization,

title = {Visualization of wildfire simulations},

author = {Patrick McCormick and James Ahrens },

url = {http://datascience.dsscale.org/wp-content/uploads/2016/06/VisualizationOfWildfireSimulations.pdf},

year  = {1998},

date = {1998-01-01},

journal = {Computer Graphics and Applications, IEEE},

volume = {18},

number = {2},

pages = {17--19},

publisher = {IEEE},

abstract = {Newspaper headlines constantly remind us of the human and property losses we suffer from wildfires, severe storms, earthquakes, and other natural disasters. These disasters cost the United States hundreds of lives and billions of dollars annually. Scientists at Los Alamos National Laboratory are developing computer models to predict the evolution of such disasters. Predicting the course of these events in faster than real time permits developing management strategies to minimize their adverse consequences. Presently, the complexity of models that forecast crises requires the advanced computing systems available at Los Alamos. In the near future, these models will be adapted for use in planning, training, and operational situations, but will still require advanced computing systems to run.},

note = {LA-UR-98-0646},

keywords = {},

pubstate = {published},

tppubtype = {article}

}
Ahrens, James; McCormick, Patrick; Bossert, James; Reisner, Jon; Winterkamp, Judith
Case study: Wildfire visualization Proceedings Article
In: Visualization'97., Proceedings, pp. 451–454, IEEE 1997, (LA-UR-97-2761).
@inproceedings{ahrens1997case,

title = {Case study: Wildfire visualization},

author = {James Ahrens and Patrick McCormick and James Bossert and Jon Reisner and Judith Winterkamp},

url = {http://datascience.dsscale.org/wp-content/uploads/2016/06/CaseStudyWildfireVisualization.pdf},

year  = {1997},

date = {1997-01-01},

booktitle = {Visualization'97., Proceedings},

pages = {451--454},

organization = {IEEE},

abstract = {The ability to forecast the progress of crisis events would significantly reduce human suffering and loss of life, the destruction of property, and expenditures for assessment and recovery. Los Alamos National Laboratory has established a scientific thrust in crisis forecasting to address this national challenge. In the initial phase of this project, scientists at Los Alamos are developing computer models to predict the spread of a wildfire. Visualization of the results of the wildfire simulation will be used by scientists to assess the quality of the simulation and eventually by fire personnel as a visual forecast of the wildfire’s evolution. The fire personnel and scientists want the visualization to look as realistic as possible without compromising scientific accuracy. This paper describes how the visualization was created, analyzes the tools and approach that was used, and suggests directions for future work and research.},

note = {LA-UR-97-2761},

keywords = {},

pubstate = {published},

tppubtype = {inproceedings}

}